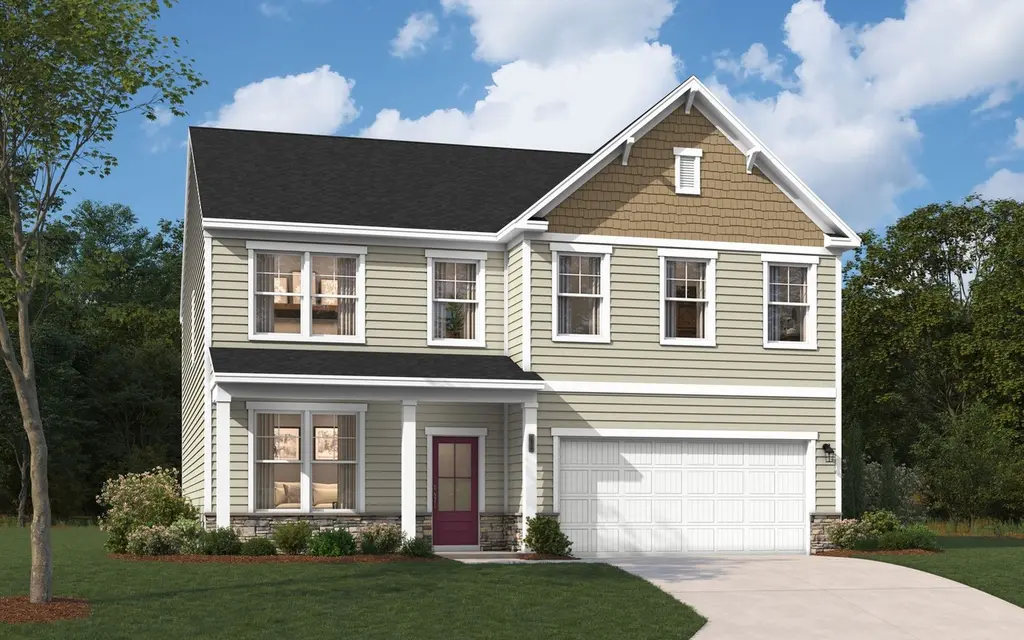
513 Rumson Ln
Fountain Inn, SC 29644
$400,292D
4 bd · 3.0 ba ·
2,917 sqft ·
Built 2026
· SingleFamily
· Active
· 10 DOM
Cashflow @ list (25.0% down · 7.5%)
Estimated rent
$3,219/mo
Mortgage (P&I)
−$2,099
Tax + insurance
−$667
HOA
−$0
Vac / Maint / Mgmt
−$676
Net cashflow
$-224/mo
Annual
$-2,684/yr
Cap rate
5.62%
Cash-on-cash
-2.39%
DSCR
0.89
1% rule
0.80%
Cash to close
$112,082
Investor read
- This is a 4-bed/3.0-bath single-family listed at $400k. Condition is rated poor.
- At list price, monthly cash flow is $-224 ($-3k/yr) — negative.
- To cash-flow at today's rent, offer at most $368k (8.1% below list).
- To meet the 1% rule (rent ≥ 1% of price), the offer needs to be $322k (19.6% below list).
- Only 10 days on market — expect competitive offers; lowballing is unlikely to land.
- Recommended offer: $322k (19.6% below list) — sets the bar for 1% rule.
- Local home prices are declining (-3.0%/yr); year-one equity from $3k of loan paydown is wiped out by about $12k of value loss. Plan a longer hold.
- Location reads 82/100 on livability (#4 in SC, #1,162 nationally) — a professional / high-income tenant draw. Strengths: crime A+, cost of living A+, housing A+; Watch: commute F.
- Greenville 01 (suburban): math 44% / reading 54% proficiency, ranked #10 of 80 in SC (top 12%) — families likely to look elsewhere, expect single-tenant / working-renter base with shorter leases.
- Market conditions: Rents rising fast (+4.5%/yr); 482 active listings in the ZIP; 2 comparable units currently listed for rent nearby; 5,595 units permitted in Greenville County in 2024 (566 in 5+ unit buildings).
- Greenville County population projected at +34% by 2050 — long-run rental-demand tailwind backs the buy-and-hold thesis.
- Climate carrying-cost: extreme-heat days projected 7→16/yr by 2055 (HVAC capex compounding) — expect insurance premiums to compound above CPI over the hold.
- Cap rate 5.6% vs local median 4.2% in Fountain Inn — top-decile yield for the area; either an underpriced asset or a hidden risk that comps aren't pricing in. Stress-test before assuming the spread holds.
- At $3,219/mo this rent would consume 55% of the median local household income ($70k/yr) (locally 475% of renters already pay >50% of income on rent) — very limited rent-growth headroom before tenants either downsize or default.
Questions for listing agent
- What do current leases actually rent for vs. the listed asking? Can we see a recent rent roll and the last 12 months of T-12 income?
- Have any recent inspections been done? Can we get a copy of the seller's disclosures and any deferred-maintenance estimates?
- Is there a deadline driving the sale (1031 exchange, divorce, estate, relocation)? That informs how much negotiation room exists.
- The area grade is low — what's the realistic commute time and amenity access for the typical tenant pool here? Any planned neighborhood developments (good or bad) we should know about?
- What's the average days-on-market for RENTAL listings here right now (not sales)? A rising rental-DOM trend means longer vacancies and softer asking-rent achievability than the comps imply.
- What's the recent tenant-quality profile in this submarket — average credit score on applications, eviction rate, late-payment / NSF rate, and stable-employment percentage? A property-management company in the area should have these aggregated.
- How much new for-sale + rental construction is in the pipeline within 1–3 miles? Heavy new supply typically softens prices + rents 12–24 months out; constrained supply supports both.
Repairs flagged (vision-AI assessment)
- Major: roof — Significant wear and potential leakage.
- Major: exterior siding — Visible cracks and discoloration.
- Major: flooring — Old and worn, with visible damage and discoloration.
- Major: interior walls/paint — Peeling paint and significant discoloration.
- Major: HVAC condensers — Old and possibly in need of maintenance or replacement.
- Major: landscaping — Overgrown and in need of trimming and maintenance. No visible curb appeal features.
CashFlowRE · CFR-JTP1BJ6WRV3KVN
· Data 2 days ago
cashflowre.app · 2026-05-29