513 Rumson Ln · Fountain Inn, SC
Flood risk 1/10 · Minimal
- FEMA flood zone
- X (unshaded)
- Chance of flooding over 30 yrs
- 0.0%
- Est. flood insurance / yr
- $507 – $1,088
Fire risk 4/10 · Minor
- Est. fire insurance / yr
- $783 – $1,453
Heat risk 5/10 · Moderate
- Hot days now (above 104°F)
- 7 days/yr
- Hot days in 30 yrs
- 16 days/yr
Wind risk 2/10 · Minimal
- Chance of severe wind over 30 yrs
- 2.0%
Air-quality risk 3/10 · Minor
- Unhealthy air days now
- 3 days/yr
- Unhealthy air days in 30 yrs
- 3 days/yr
Risk factors via First Street. Map © Google.
Why this score? — see what drove the D grade
The composite is a weighted blend of 9 inputs, each scored 0–100. Each bar is that input's sub-score; the figure is the points it added to the 100-point composite (weight × sub-score).
- ARV discount +12.1/15.0
- Cash flow +10.2/30.0
- Schools +4.2/10.0
- Livability +4.1/5.0
- Rent growth +3.6/5.0
- 1% rule +3.0/10.0
- DSCR +2.9/10.0
- Condition / age +1.0/5.0
- Appreciation +0.0/10.0
$400,292
🖨 Deal sheet 📄 Offer letter ✓ Due diligence
Listing remarks
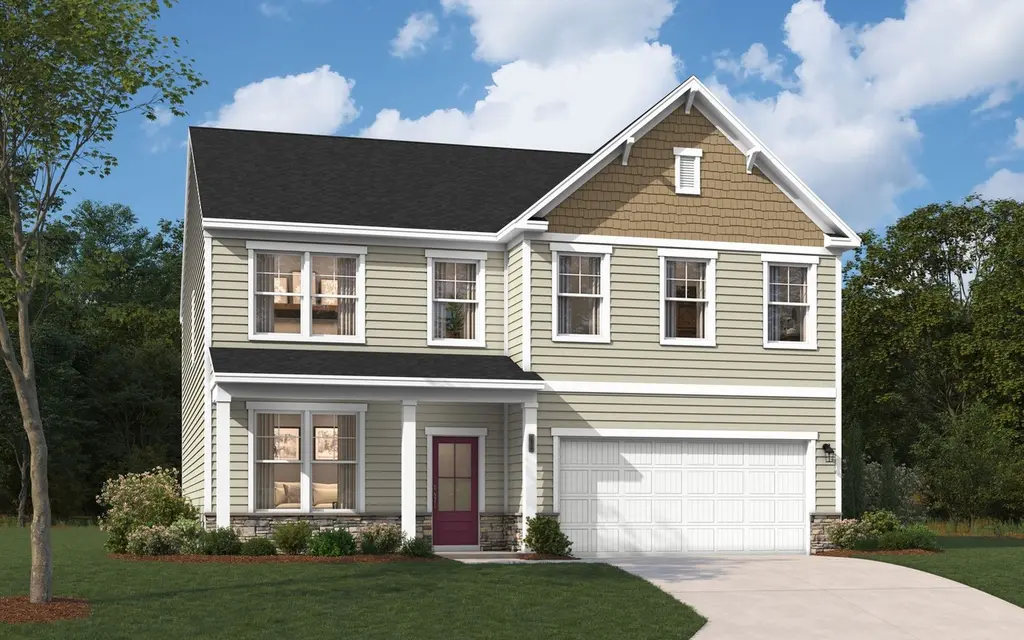
Take a look at the Kershaw at Hamptons, a condo neighborhood with a pickleball court, playground, and green spaces, minutes from shopping and dining. This Kershaw spans two floors across roughly 2,900 square feet, with an open main level where the kitchen island connects directly to the family room. A guest bedroom on the main level sits near a full bath, giving visitors their own space without going upstairs. The covered patio extends the main level outward, adding room for evenings outside when the weather cooperates. Upstairs, the primary suite includes a walk-in closet and a private bath, while two additional bedrooms, each with walk-in closets, share a full bath nearby. A two-car garag
Key facts
- Central island
- Walk in closet
- En suite bath
Tags
Property features AI
Finance
- Financial info: List price $400,292
Exterior
- Parking: 2 garage spaces; 2 total parking spaces
- Home design: Single-family residence (The Kershaw plan)
- Exterior features: Living area of 2917
Interior
- Bedrooms: 4 bedrooms
- Bathrooms: 3 full bathrooms
- Interior features: Spec home (The Kershaw plan); Active listing
Neighborhood map
What this means for you Summary
Snapshot
- This is a 4-bed/3.0-bath single-family listed at $400k. Condition is rated poor.
Deal economics
- At list price, monthly cash flow is $-224 ($-3k/yr) — negative.
- To cash-flow at today's rent, offer at most $368k (8.1% below list).
- To meet the 1% rule (rent ≥ 1% of price), the offer needs to be $322k (19.6% below list).
- Recommended offer: $322k (19.6% below list) — sets the bar for 1% rule.
- Cap rate 5.6% vs local median 4.2% in Fountain Inn — top-decile yield for the area; either an underpriced asset or a hidden risk that comps aren't pricing in. Stress-test before assuming the spread holds.
Location & tenants
- Location reads 82/100 on livability (#4 in SC, #1,162 nationally) — a professional / high-income tenant draw. Strengths: crime A+, cost of living A+, housing A+; Watch: commute F.
- Greenville 01 (suburban): math 44% / reading 54% proficiency, ranked #10 of 80 in SC (top 12%) — families likely to look elsewhere, expect single-tenant / working-renter base with shorter leases.
- Market conditions: Rents rising fast (+4.5%/yr); 482 active listings in the ZIP; 2 comparable units currently listed for rent nearby; 5,595 units permitted in Greenville County in 2024 (566 in 5+ unit buildings).
- At $3,219/mo this rent would consume 55% of the median local household income ($70k/yr) (locally 475% of renters already pay >50% of income on rent) — very limited rent-growth headroom before tenants either downsize or default.
Forward outlook
- Local home prices are declining (-3.0%/yr); year-one equity from $3k of loan paydown is wiped out by about $12k of value loss. Plan a longer hold.
- Greenville County population projected at +34% by 2050 — long-run rental-demand tailwind backs the buy-and-hold thesis.
Negotiation context
- Only 10 days on market — expect competitive offers; lowballing is unlikely to land.
Risks & watch-outs
- Climate carrying-cost: extreme-heat days projected 7→16/yr by 2055 (HVAC capex compounding) — expect insurance premiums to compound above CPI over the hold.
Questions for the listing agent
- What do current leases actually rent for vs. the listed asking? Can we see a recent rent roll and the last 12 months of T-12 income?
- Have any recent inspections been done? Can we get a copy of the seller's disclosures and any deferred-maintenance estimates?
- Is there a deadline driving the sale (1031 exchange, divorce, estate, relocation)? That informs how much negotiation room exists.
- The area grade is low — what's the realistic commute time and amenity access for the typical tenant pool here? Any planned neighborhood developments (good or bad) we should know about?
- What's the average days-on-market for RENTAL listings here right now (not sales)? A rising rental-DOM trend means longer vacancies and softer asking-rent achievability than the comps imply.
- What's the recent tenant-quality profile in this submarket — average credit score on applications, eviction rate, late-payment / NSF rate, and stable-employment percentage? A property-management company in the area should have these aggregated.
- How much new for-sale + rental construction is in the pipeline within 1–3 miles? Heavy new supply typically softens prices + rents 12–24 months out; constrained supply supports both.
Investment metrics
- 1% rule
- 0.80% ✗
- Cap rate
- 5.62%
- Cash-on-cash
- -2.39%
- DSCR
- 0.89
- GRM
- 10.4
CMA / ARV
- ARV (on-the-fly)
- $446,301
- Comps found
- 8
Show comp detail 8 sales within ~0.75 mi
| Address | Dist | Beds/Ba | Sqft | Sold | Price | $/sf | Match |
|---|---|---|---|---|---|---|---|
| 620 Hollybank St | 0.73mi | 5/4.0 (+1) | 2,995 (+3%) | 2mo | $432,900 | $145 | 51 |
| 609 Hollybank St | 0.72mi | 5/4.0 (+1) | 2,995 (+3%) | 3mo | $400,000 | $134 | 50 |
| 621 Hollybank St | 0.74mi | 5/3.0 (+1) | 2,742 (-6%) | 0mo | $425,000 | $155 | 50 |
| 6 Shallow Creek Ct | 0.43mi | 4/2.5 | 2,583 (-12%) | 12mo | $565,000 | $219 | 49 |
| 344 Hazelcroft Dr | 0.71mi | 5/4.0 (+1) | 2,937 (+1%) | 16mo | $429,900 | $146 | 44 |
| 344 Hazelcroft Dr | 0.71mi | 5/4.0 (+1) | 2,995 (+3%) | 16mo | $429,900 | $144 | 40 |
| 401 Hazelcroft Dr | 0.73mi | 5/3.0 (+1) | 2,742 (-6%) | 24mo | $418,900 | $153 | 31 |
| 340 Hazelcroft Dr | 0.70mi | 5/3.0 (+1) | 2,674 (-8%) | 22mo | $408,000 | $153 | 31 |
Match score weights: distance 35% · size 25% · config 20% · recency 20%. Top-matched comps best support the ARV.
Projected returns pro-forma
-3.0% appreciation · 4.55% rent growth · sell at horizon
- IRR
- -18.5%
- Equity multiple
- 0.34×
- Total profit
- $-73,963
- Equity at exit
- $59,685
- IRR
- -8.1%
- Equity multiple
- 0.46×
- Total profit
- $-60,962
- Equity at exit
- $34,610
Cash invested: $112,082 (down + closing). Projections, not guarantees.
Landlord ↔ Tenant lean methodology
- Overall (STATE)
- 90 Strongly Landlord-Friendly
- State South Carolina
- 90 Strongly Landlord-Friendly · R+6
- County
- — inherits STATE
- City
- — inherits STATE
ZIP-level market 29644
- Home prices YoY
- -28.6%
- Rents YoY
- 4.5%
- Active inventory
- 482
- Price-to-rent
- 10.4×
Monthly cashflow live
- Estimated rent
- $3,219 medium interval (Pro) →
- Mortgage (P&I)
- −$2,099
- Tax est. 1.5%
- −$500 /mo · $6,004/yr
- Insurance
- −$167
- HOA
- −$0
- Vacancy / Maint / Mgmt
- −$676
- Net cashflow
- $-224
Break-even live
UW: 25.0% down · 7.5% · 30yr · 1.5% tax · 5.0% vac · 8.0% maint · 8.0% mgmt
Financing live
Cash to close
- Down payment
- $100,073
- Closing costs
- $12,009
- Reserves months
- —
- Total cash needed
- —
Loan-product check · same deal, 3 products live
Conventional
25% down · 7.5% · 30yr
- Down + closing
- —
- Monthly P&I
- —
- Monthly cashflow
- —
- DSCR
- —
- Eligible?
- —
Personal DTI + credit; lowest rate.
DSCR
20% down · 8.5% · 30yr
- Down + closing
- —
- Monthly P&I
- —
- Monthly cashflow
- —
- DSCR
- —
- Eligible?
- —
No personal income docs; deal must DSCR.
Hard money
10% down · 12.0% · 12mo
- Down + closing
- —
- Monthly P&I
- —
- Monthly cashflow
- —
- DSCR
- —
- Eligible?
- —
Short-term bridge; refi at stabilization.
Rent comps 2 comps
| Address | Beds | Baths | Sqft | Rent | $/sqft | DOM | Units | Dist |
|---|---|---|---|---|---|---|---|---|
| 119 Cranford Rd Fountain Inn, SC | 4.0 | 3.0 | 2174 | $2,495 | $1.15 | 19d | 1 | 0.60mi |
| 404 Blue Sage Pl Simpsonville, SC | 4.0 | 2.0 | 1950 | $6,000 | $3.08 | 23d | 1 | 1.38mi |
Listing history 9 events
-
2026-06-18days on market $400,292 Active 10 DOM
-
2026-06-17days on market $400,292 Active 9 DOM
-
2026-06-16days on market $400,292 Active 8 DOM
-
2026-06-15days on market $400,292 Active 7 DOM
-
2026-06-13days on market $400,292 Active 5 DOM
-
2026-06-13days on market $400,292 Active 4 DOM
-
2026-06-10days on market $400,292 Active 2 DOM
-
2026-06-09remarks 699-char remark
-
2026-06-09$400,292 Active 1 DOM
ⓘ Source: listings_history table (triggers on properties + properties_extension) + one-shot
backfill from property_details.listing_events for pre-trigger history.
Climate risk First Street
- Flood 1/10 Low FEMA zone X (unshaded) · 0% chance over 30 yrs
- Wildfire 4/10 Moderate
- Heat 5/10 Major 7 d/yr ≥104°F today · 16 d/yr by 30 yrs out
- Wind 2/10 Low 2% chance of damaging wind over 30 yrs
- Air quality 3/10 Moderate 3 unhealthy d/yr today · 3 by 30 yrs out
Nearby sold comps map
Loading sold comps map…
Walkable amenities ~0.75 mi
Loading nearby amenities…
Taxation est. · year 1
- Rental income
- $38,623
- − Mortgage interest
- −$22,423
- − Property taxes
- −$6,004
- − Insurance
- −$2,001
- − Repairs & maintenance
- −$3,090
- − Management
- −$3,090
- − Depreciation
- −$11,645
- Taxable loss
- −$9,630
- Est. tax savings @ 24.0%
- +$2,311
- After-tax cash flow
- $-373/yr
For passive investors: Depreciation is non-cash, so a rental often shows a tax loss while cash-flowing — sheltering income. Rental losses are passive: they offset passive income freely, and up to $25,000/yr can offset ordinary (W-2) income if you actively participate and your MAGI is under $100k (phasing out to $0 by $150k); unused losses carry forward. On sale, claimed depreciation is recaptured at up to 25%, and gains may owe capital-gains tax (a 1031 exchange can defer both). Figures are a year-1 estimate at your 24.0% rate — not tax advice; consult a CPA.
Condition & rehab AI · 1 photo
This property requires extensive repairs and maintenance, including a new roof, exterior siding repair and painting, HVAC replacement, and landscaping improvements. Significant value can be added through these updates, both for resale and rental purposes.
Repairs flagged
- Major roof — Significant wear and potential leakage.
- Major exterior siding — Visible cracks and discoloration.
- Major flooring — Old and worn, with visible damage and discoloration.
- Major interior walls/paint — Peeling paint and significant discoloration.
- Major HVAC condensers — Old and possibly in need of maintenance or replacement.
- Major landscaping — Overgrown and in need of trimming and maintenance. No visible curb appeal features.
Value-add opportunities
- Resale roof replacement — A new roof would significantly improve the home's appearance and value.
- Resale exterior siding repair and painting — Repairing and repainting the exterior siding would improve the home's curb appeal and value.
- Resale HVAC replacement — A new HVAC system would improve comfort and energy efficiency, enhancing the home's value.
- Resale landscaping and curb appeal improvements — A well-maintained and landscaped exterior would significantly enhance the home's curb appeal and value.
- Resale interior painting and flooring repair — Repainting and repairing the interior would improve the home's appearance and value.
- Rental landscaping and curb appeal improvements — A well-maintained and landscaped exterior would significantly enhance the home's curb appeal and rental value.
- Rental HVAC replacement — A new HVAC system would improve comfort and energy efficiency, enhancing the home's rental value.
- Rental interior painting and flooring repair — Repainting and repairing the interior would improve the home's appearance and rental value.
- Rental landscaping and curb appeal improvements — A well-maintained and landscaped exterior would significantly enhance the home's curb appeal and rental value.
Renovation cost estimate screening
| Repair item | Severity | Est. cost |
|---|---|---|
| roof · Significant wear and potential leakage. | Major | $15,000–50,000 |
| exterior siding · Visible cracks and discoloration. | Major | $15,000–50,000 |
| flooring · Old and worn, with visible damage and discoloration. | Major | $15,000–50,000 |
| interior walls/paint · Peeling paint and significant discoloration. | Major | $15,000–50,000 |
| HVAC condensers · Old and possibly in need of maintenance or replacement. | Major | $15,000–50,000 |
| landscaping · Overgrown and in need of trimming and maintenance. No visible curb appeal features. | Major | $15,000–50,000 |
| Total estimated repair cost · 6 items | $90,000–300,000 |
Value-add ROI direction
- Resale roof replacement — A new roof would significantly improve the home's appearance and value. ↑
- Resale exterior siding repair and painting — Repairing and repainting the exterior siding would improve the home's curb appeal and value. ↑
- Resale HVAC replacement — A new HVAC system would improve comfort and energy efficiency, enhancing the home's value. ↑
- Resale landscaping and curb appeal improvements — A well-maintained and landscaped exterior would significantly enhance the home's curb appeal and value. ↑
- Resale interior painting and flooring repair — Repainting and repairing the interior would improve the home's appearance and value. ↑
- Rental landscaping and curb appeal improvements — A well-maintained and landscaped exterior would significantly enhance the home's curb appeal and rental value. ↑
- Rental HVAC replacement — A new HVAC system would improve comfort and energy efficiency, enhancing the home's rental value. ↑
- Rental interior painting and flooring repair — Repainting and repairing the interior would improve the home's appearance and rental value. ↑
- Rental landscaping and curb appeal improvements — A well-maintained and landscaped exterior would significantly enhance the home's curb appeal and rental value. ↑
ⓘ Cost ranges are severity-bucket heuristics (US national rule-of-thumb). Get contractor quotes + a written scope before underwriting a rehab budget.
Schools (NCES district)
- District
- Greenville 01
- NCES district ID
- 4502310
- Math proficiency
- 44% ▼ -10.00%
- Reading proficiency
- 54% ▼ -2.00%
- Median HH income
- $49,596
- Composite
- 41.88/100
- National rank
- #3370
- State rank
- #10 of 80 in SC
Livability — Fountain Inn
- Score
- 82/100
- State rank
- #4
- US rank
- #1162
Category grades
Schools grade is shown separately in the Schools card above.
Census & demographics
- Census place
- Fountain Inn, SC
- County
- Greenville County · 573,815 people
- City population
- 22,907
- Metro
- Greenville-Anderson, SC
- Population (ZIP)
- 22,907
- Household income
- $70,301
- Rent vs Own
- Severe rent burden
- 475.0
Population outlook (Greenville County) Hauer SSP2
- Today (2025)
- 574,580 people
- By 2030
- 615,615 · +7.1%
- By 2040
- 695,373 · +21.0%
- By 2050
- 769,367 · +33.9%
- By 2075
- 933,296 · +62.4%
- By 2100
- 1,029,196 · +79.1%
Race, ethnicity, and origin ACS 2023
- Neighborhood character
- Predominantly White (66%)
- Race & ethnicity
- White 66% Black 18% Two or more races 10% Hispanic / Latino 10%
- Hispanic origin (detail)
- Mexican 3% Puerto Rican 2%
- Common ancestry
- Slovak 3% Romanian 2% Lithuanian 2%
- Foreign-born
- 6% · Canada, Jamaica
- Languages at home
- 89% English-only · Spanish 9% Tagalog/Filipino 1%
Political lean MEDSL · Greenville
- 2024 margin
- Strong R (+22.2) · D 38.0% · R 60.2% · Other 1.8%
- 2008→2024 swing
- +1.7pp toward D · 2008: -23.9pp · 2024: -22.2pp
- All cycles
- 2024: R+22.2 2020: R+18.2 2016: R+24.7 2012: R+27.8 2008: R+23.9
Not yet ingested
- Civics
- —
Market trends
- HPI YoY
- ▼ -100.45%
- Current HPI
- 250.5271
- Rent YoY
- ▲ 4.55%
- Metro
- Greenville-Anderson, SC
- State GDP YoY
- ▲ 4.51%
- F500 in state
- 2
Industry mix (Fortune 500 HQ in SC)
| Industry | F500 HQs | Revenue |
|---|---|---|
| Packaging | 1 | $7B |
|
||
Cash-flow waterfall
monthlySold comps — $/sqft
last 12 mo · ≤1 miLoading sold comps…