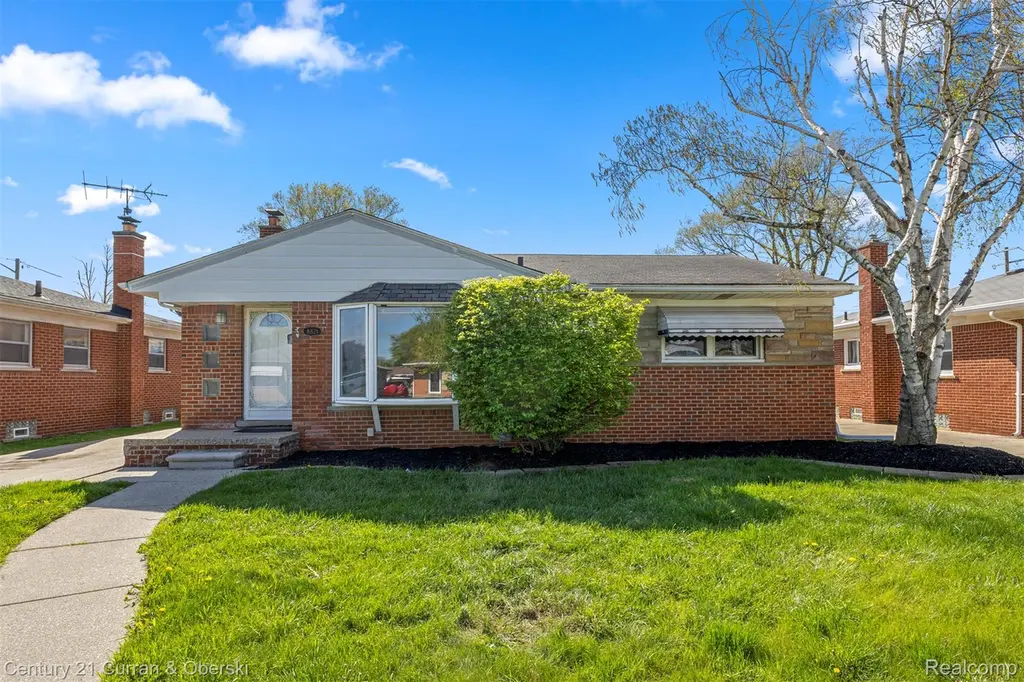
8821 Royal Grand
Dearborn Heights, MI 48239
$220,000D-
3 bd · 1.5 ba ·
1,159 sqft ·
Built 1957
· SingleFamily
· Pending
· 37 DOM
Cashflow @ list (25.0% down · 7.5%)
Estimated rent
$1,737/mo
Mortgage (P&I)
−$1,154
Tax + insurance
−$378
HOA
−$0
Vac / Maint / Mgmt
−$365
Net cashflow
$-160/mo
Annual
$-1,920/yr
Cap rate
5.42%
Cash-on-cash
-3.12%
DSCR
0.86
1% rule
0.79%
Cash to close
$61,600
Investor read
- This is a 3-bed/1.5-bath single-family listed at $220k.
- At list price, monthly cash flow is $-160 ($-2k/yr) — negative.
- To cash-flow at today's rent, offer at most $192k (12.8% below list).
- To meet the 1% rule (rent ≥ 1% of price), the offer needs to be $174k (21.1% below list).
- It's been on market 37 days — a 3% lower offer ($213k) is reasonable based on typical stale-listing flexibility.
- Recommended offer: $174k (21.1% below list) — sets the bar for 1% rule.
- Local home prices are declining (-3.0%/yr); year-one equity from $2k of loan paydown is wiped out by about $7k of value loss. Plan a longer hold.
- Location reads 79/100 on livability (#82 in MI, #1,885 nationally) — a middle-class / working-renter tenant base. Strengths: commute A+, cost of living A+, housing A+; Watch: crime D+, employment D+, health & safety D+.
- South Redford School District (suburban): math 11% / reading 29% proficiency, ranked #455 of 540 in MI (top 84%) — low school quality limits family demand, transient renter base, plan for 1-2y turnover.
- Zoned schools: Vandenberg Elementary School (math 5% / reading 15%, grade F, #1,230 of 1,397 statewide, top 91%, 279 students, 82% FRL); John D Pierce Middle School (math 8% / reading 29%, grade F, #432 of 493 statewide, top 88%, 602 students, 68% FRL); Lee M Thurston High School (math 12% / reading 32%, grade F, #582 of 713 statewide, top 83%, 883 students, 62% FRL) — zoned schools average 71% FRL vs 52% district-wide (19 pts higher); higher-poverty schools than district average — tighter screening recommended.
- Watch-outs: built in 1957 — expect roof / HVAC / electrical / plumbing capex.
- Market conditions: Rents rising (+3.2%/yr); 193 active listings in the ZIP; 13 comparable units currently listed for rent nearby; rentals at typical pace (median 20d on market — plan ~3-4 weeks tenant-placement turnaround); 2,639 units permitted in Wayne County in 2024 (1,216 in 5+ unit buildings).
- Wayne County population projected at -17% by 2050 — secular population decline; favor cash flow + early exit over multi-decade hold.
- 4 sale attempts; this cycle's ask is 10% above the opening price — seller raised mid-cycle; expect resistance to lowballs.
- Current owner paid $96k; list at $220k implies a 129% gain — meaningful room to come down on a strong offer.
Questions for listing agent
- What do current leases actually rent for vs. the listed asking? Can we see a recent rent roll and the last 12 months of T-12 income?
- It's been on market 37 days. Have you received any prior offers? Is the seller open to a 21% concession, seller financing, or rate buy-down credit?
- Built in 1957 — when were the roof, HVAC, electrical panel, plumbing, and water heater last replaced?
- Is there a deadline driving the sale (1031 exchange, divorce, estate, relocation)? That informs how much negotiation room exists.
- Crime grade is D in this area — have there been break-ins, vandalism, or insurance claims at this property in the last 3 years? What carrier currently insures it and at what premium?
- The area grade is low — what's the realistic commute time and amenity access for the typical tenant pool here? Any planned neighborhood developments (good or bad) we should know about?
- What's the average days-on-market for RENTAL listings here right now (not sales)? A rising rental-DOM trend means longer vacancies and softer asking-rent achievability than the comps imply.
- What's the recent tenant-quality profile in this submarket — average credit score on applications, eviction rate, late-payment / NSF rate, and stable-employment percentage? A property-management company in the area should have these aggregated.
CashFlowRE · CFR-JTYRMK3D5S60C6
· Data 1 day ago
cashflowre.app · 2026-05-29