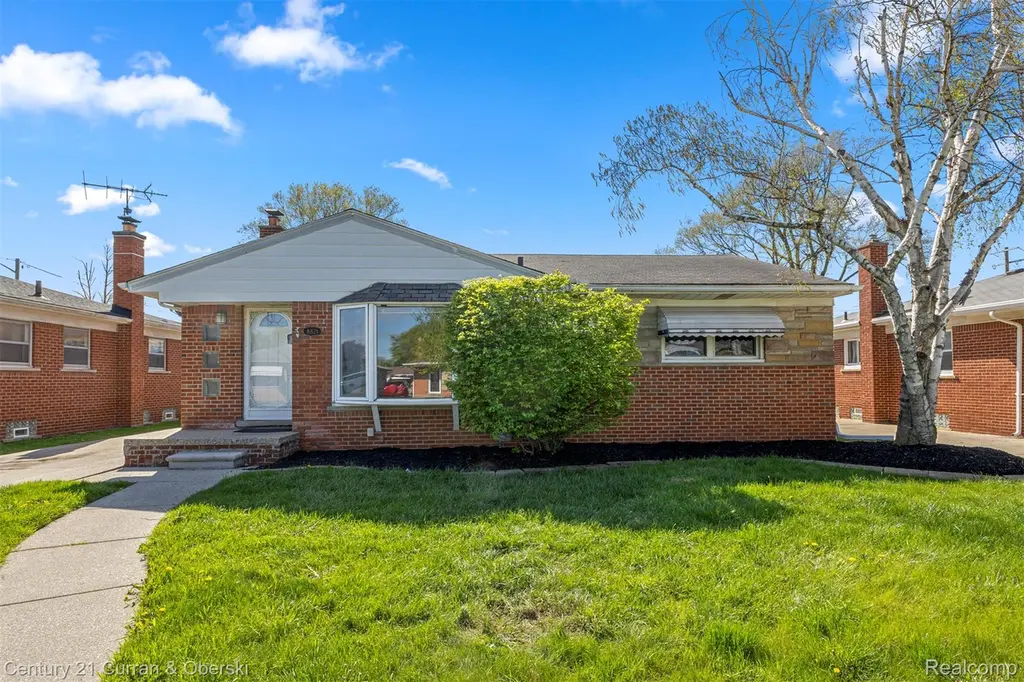
8821 Royal Grand · Dearborn Heights, MI
Flood risk 1/10 · Minimal
- FEMA flood zone
- X (unshaded)
- Chance of flooding over 30 yrs
- 0.0%
- Est. flood insurance / yr
- $473 – $860
Fire risk 1/10 · Minimal
- Est. fire insurance / yr
- $784 – $1,456
Heat risk 3/10 · Minor
- Hot days now (above 98°F)
- 7 days/yr
- Hot days in 30 yrs
- 15 days/yr
Wind risk 2/10 · Minimal
- Chance of severe wind over 30 yrs
- —
Air-quality risk 3/10 · Minor
- Unhealthy air days now
- 2 days/yr
- Unhealthy air days in 30 yrs
- 3 days/yr
Risk factors via First Street. Map © Google.
Why this score? — see what drove the D- grade
The composite is a weighted blend of 9 inputs, each scored 0–100. Each bar is that input's sub-score; the figure is the points it added to the 100-point composite (weight × sub-score).
- ARV discount +12.0/15.0
- Cash flow +9.3/30.0
- Livability +4.0/5.0
- Rent growth +3.3/5.0
- 1% rule +2.9/10.0
- DSCR +2.6/10.0
- Condition / age +2.5/5.0
- Schools +1.8/10.0
- Appreciation +0.0/10.0
$220,000
🖨 Deal sheet (PDF) 📄 Offer letter ✓ Due diligence
Listing remarks MLS
Discover a lifestyle of comfort and ease at 8821 Royal Grand, a welcoming single-family residence built in 1957, located in Redford Charter Township, MI. This inviting home is ready for you to move in and begin your next chapter. The kitchen is appointed with matching black appliances, offering a cohesive and functional space for culinary endeavors. The bedrooms feature warm hardwood flooring, adding a touch of classic elegance and comfort underfoot. Beyond the main living areas, a private yard provides a personal outdoor sanctuary. A billiard room, presenting an additional space for recreation and enjoyment. To truly appreciate the thoughtful design and comfortable living offered by this property, schedule your private viewing today. Hardwood floors are freshly finished. Brand new carpet in bedrooms. Master bedroom has an addition that is mutli purpose sitting room/office/nursey.
Key facts
- New carpet
- Private yard
- Billiard room
Tags
Property features AI
Finance
- Other: Lot approximately 0.16 acres (dimensions 55 x 127.96)
Exterior
- Parking: Detached 1-car garage
- Utilities: Public water; Public sewer
- Home design: Single family residence; One story; Ground-level entry with steps
- Construction: Aluminum siding, brick and stone exterior; Block foundation; Asphalt roof; Built with above-grade and below-grade finished living areas
- Exterior features: Back yard fencing; Paved road access
Interior
- Kitchen: Dishwasher; Free-standing electric oven; Microwave
- Bathrooms: 1 full bathroom; 1 half bathroom
- Heating & cooling: Forced air heating (natural gas); Central air conditioning; Ceiling fans
- Interior features: Full, partially finished basement; 6 total rooms
- Laundry & utility: Washer; Dryer; Gas water heater
Neighborhood map
What this means for you Summary
Snapshot
- This is a 3-bed/1.5-bath single-family listed at $220k.
Deal economics
- At list price, monthly cash flow is $-160 ($-2k/yr) — negative.
- To cash-flow at today's rent, offer at most $192k (12.8% below list).
- To meet the 1% rule (rent ≥ 1% of price), the offer needs to be $174k (21.1% below list).
- Recommended offer: $174k (21.1% below list) — sets the bar for 1% rule.
Location & tenants
- Location reads 79/100 on livability (#82 in MI, #1,885 nationally) — a middle-class / working-renter tenant base. Strengths: commute A+, cost of living A+, housing A+; Watch: crime D+, employment D+, health & safety D+.
- South Redford School District (suburban): math 11% / reading 29% proficiency, ranked #455 of 540 in MI (top 84%) — low school quality limits family demand, transient renter base, plan for 1-2y turnover.
- Zoned schools: Vandenberg Elementary School (math 5% / reading 15%, grade F, #1,230 of 1,397 statewide, top 91%, 279 students, 82% FRL); John D Pierce Middle School (math 8% / reading 29%, grade F, #432 of 493 statewide, top 88%, 602 students, 68% FRL); Lee M Thurston High School (math 12% / reading 32%, grade F, #582 of 713 statewide, top 83%, 883 students, 62% FRL) — zoned schools average 71% FRL vs 52% district-wide (19 pts higher); higher-poverty schools than district average — tighter screening recommended.
- Market conditions: Rents rising (+3.2%/yr); 193 active listings in the ZIP; 13 comparable units currently listed for rent nearby; rentals at typical pace (median 19d on market — plan ~3-4 weeks tenant-placement turnaround); 2,639 units permitted in Wayne County in 2024 (1,216 in 5+ unit buildings).
Forward outlook
- Local home prices are declining (-3.0%/yr); year-one equity from $2k of loan paydown is wiped out by about $7k of value loss. Plan a longer hold.
- Wayne County population projected at -17% by 2050 — secular population decline; favor cash flow + early exit over multi-decade hold.
Negotiation context
- It's been on market 37 days — a 3% lower offer ($213k) is reasonable based on typical stale-listing flexibility.
- 4 sale attempts; this cycle's ask is 10% above the opening price — seller raised mid-cycle; expect resistance to lowballs.
- Current owner paid $96k; list at $220k implies a 129% gain — meaningful room to come down on a strong offer.
Risks & watch-outs
- Watch-outs: built in 1957 — expect roof / HVAC / electrical / plumbing capex.
Questions for the listing agent
- What do current leases actually rent for vs. the listed asking? Can we see a recent rent roll and the last 12 months of T-12 income?
- It's been on market 37 days. Have you received any prior offers? Is the seller open to a 21% concession, seller financing, or rate buy-down credit?
- Built in 1957 — when were the roof, HVAC, electrical panel, plumbing, and water heater last replaced?
- Is there a deadline driving the sale (1031 exchange, divorce, estate, relocation)? That informs how much negotiation room exists.
- Crime grade is D in this area — have there been break-ins, vandalism, or insurance claims at this property in the last 3 years? What carrier currently insures it and at what premium?
- The area grade is low — what's the realistic commute time and amenity access for the typical tenant pool here? Any planned neighborhood developments (good or bad) we should know about?
- What's the average days-on-market for RENTAL listings here right now (not sales)? A rising rental-DOM trend means longer vacancies and softer asking-rent achievability than the comps imply.
- What's the recent tenant-quality profile in this submarket — average credit score on applications, eviction rate, late-payment / NSF rate, and stable-employment percentage? A property-management company in the area should have these aggregated.
- How much new for-sale + rental construction is in the pipeline within 1–3 miles? Heavy new supply typically softens prices + rents 12–24 months out; constrained supply supports both.
Investment metrics
- 1% rule
- 0.79% ✗
- Cap rate
- 5.42%
- Cash-on-cash
- -3.12%
- DSCR
- 0.86
- GRM
- 10.6
CMA / ARV
- ARV (median comp)
- $244,257
- List price
- $220,000
- Delta
- -9.93%
- Verdict
- FAIR
- Comps
- 20 within 1.0 mi
Show comp detail 12 sales within ~0.75 mi
| Address | Dist | Beds/Ba | Sqft | Sold | Price | $/sf | Match |
|---|---|---|---|---|---|---|---|
| 9130 Kinloch | 0.36mi | 3/1.5 | 1,144 (-1%) | 3mo | $123,000 | $108 | 78 |
| 26388 Ann Arbor Trl | 0.46mi | 3/1.5 | 1,194 (+3%) | 1mo | $270,000 | $226 | 72 |
| 8356 Glengary St | 0.34mi | 3/1.0 | 1,100 (-5%) | 7mo | $253,000 | $230 | 68 |
| 9335 Louis St | 0.35mi | 3/1.5 | 1,267 (+9%) | 1mo | $255,000 | $201 | 67 |
| 9010 Leverne | 0.52mi | 3/1.0 | 1,020 (-12%) | 2mo | $220,000 | $216 | 52 |
| 9938 Royal Grand | 0.68mi | 3/1.0 | 1,219 (+5%) | 6mo | $197,000 | $162 | 52 |
| 9636 Centralia | 0.61mi | 3/1.0 | 1,043 (-10%) | 4mo | $135,000 | $129 | 50 |
| 8476 Robindale Ave | 0.44mi | 3/1.0 | 1,304 (+12%) | 9mo | $180,000 | $138 | 49 |
| 8074 Nightingale St | 0.63mi | 3/1.0 | 1,020 (-12%) | 6mo | $200,000 | $196 | 44 |
| 9964 Norborne | 0.73mi | 3/1.0 | 1,033 (-11%) | 5mo | $125,900 | $122 | 42 |
| 9022 Winston | 0.64mi | 3/1.0 | 1,020 (-12%) | 8mo | $215,000 | $211 | 41 |
| 9922 Garfield | 0.73mi | 3/1.0 | 1,020 (-12%) | 8mo | $175,000 | $172 | 37 |
Match score weights: distance 35% · size 25% · config 20% · recency 20%. Top-matched comps best support the ARV.
Projected returns pro-forma
-3.0% appreciation · 3.25% rent growth · sell at horizon
- IRR
- -21.2%
- Equity multiple
- 0.26×
- Total profit
- $-45,368
- Equity at exit
- $32,803
- IRR
- -14.1%
- Equity multiple
- 0.18×
- Total profit
- $-50,684
- Equity at exit
- $19,022
Cash invested: $61,600 (down + closing). Projections, not guarantees.
Landlord ↔ Tenant lean methodology
- Overall (STATE)
- 62 Landlord-Friendly
- State Michigan
- 62 Landlord-Friendly · EVEN
- County
- — inherits STATE
- City
- — inherits STATE
ZIP-level market 48239
- Rents YoY
- 3.2%
- Active inventory
- 193
- Price-to-rent
- 10.6×
Monthly cashflow live
- Estimated rent
- $1,737 high interval (Pro) →
- Mortgage (P&I)
- −$1,154
- Tax from tax record
- −$287 /mo · $3,440/yr
- Insurance
- −$92
- HOA
- −$0
- Vacancy / Maint / Mgmt
- −$365
- Net cashflow
- $-160
Break-even live
Sensitivity live
| Price | -10% $-35 | -5% $-98 | +0% $-160 | +5% $-222 | +10% $-285 |
|---|---|---|---|---|---|
| Rent | -10% $-297 | -5% $-229 | +0% $-160 | +5% $-91 | +10% $-23 |
| Rate | -1.0pp $-49 | -0.5pp $-104 | base $-160 | +0.5pp $-217 | +1.0pp $-275 |
UW: 25.0% down · 7.5% · 30yr · 1.5% tax · 5.0% vac · 8.0% maint · 8.0% mgmt
Financing live
Cash to close
- Down payment
- $55,000
- Closing costs
- $6,600
- Reserves months
- —
- Total cash needed
- —
Loan-product check · same deal, 3 products live
Conventional
25% down · 7.5% · 30yr
- Down + closing
- —
- Monthly P&I
- —
- Monthly cashflow
- —
- DSCR
- —
- Eligible?
- —
Personal DTI + credit; lowest rate.
DSCR
20% down · 8.5% · 30yr
- Down + closing
- —
- Monthly P&I
- —
- Monthly cashflow
- —
- DSCR
- —
- Eligible?
- —
No personal income docs; deal must DSCR.
Hard money
10% down · 12.0% · 12mo
- Down + closing
- —
- Monthly P&I
- —
- Monthly cashflow
- —
- DSCR
- —
- Eligible?
- —
Short-term bridge; refi at stabilization.
Rent comps 13 comps
| Address | Beds | Baths | Sqft | Rent | $/sqft | DOM | Units | Dist |
|---|---|---|---|---|---|---|---|---|
| 8455 Robindale Ave Dearborn Heights, MI | 3.0 | 1.0 | 1100 | $1,750 | $1.59 | 6d | 1 | 0.44mi |
| 8402 Robindale Ave Dearborn Heights, MI | 3.0 | 1.0 | 1190 | $1,600 | $1.34 | 16d | 1 | 0.49mi |
| 8187 Lenore St Dearborn Heights, MI | 2.0 | 1.0 | 768 | $1,550 | $2.02 | 45d | 1 | 0.87mi |
| 27201 Canfield St W Dearborn Heights, MI | 1.0–2.0 | 1.0–2.0 | 852 | $1,499 | $1.76 | 0d | 21 | 1.01mi |
| 7462 N Vernon St Dearborn Heights, MI | 4.0 | 1.0 | 1113 | $1,900 | $1.71 | 0d | 1 | 1.21mi |
| 7080 Highview St Dearborn Heights, MI | 3.0 | 2.5 | 1105 | $2,000 | $1.81 | 20d | 1 | 1.23mi |
| 7014 Kinmore St Dearborn Heights, MI | 3.0 | 1.0 | 960 | $1,900 | $1.98 | 23d | 1 | 1.23mi |
| 12107 Centralia Redford, MI | 3.0 | 1.0 | 912 | $1,800 | $1.97 | 45d | 1 | 1.24mi |
| 79 3rd St Unit 79 Dearborn Heights, MI | 2.0 | 1.0 | 840 | $1,339 | $1.59 | 26d | 1 | 1.25mi |
| 7420 Drexel St Dearborn Heights, MI | 2.0 | 1.0 | 1080 | $1,700 | $1.57 | 45d | 1 | 1.28mi |
| 7420 Drexel St Dearborn Heights, MI | 2.0 | 1.0 | 1080 | $1,600 | $1.48 | 6d | 1 | 1.28mi |
| 7420 Drexel St Dearborn Heights, MI | 2.0 | 1.0 | 1080 | $1,700 | $1.57 | 19d | 1 | 1.28mi |
| 181 Terri Dr Unit 181 Dearborn Heights, MI | 2.0 | 2.0 | 840 | $1,119 | $1.33 | 7d | 1 | 1.35mi |
Listing history 11 events
-
2026-06-16statusdays on market $220,000 Pending 37 DOM
Show marketing remark (893 chars)
Discover a lifestyle of comfort and ease at 8821 Royal Grand, a welcoming single-family residence built in 1957, located in Redford Charter Township, MI. This inviting home is ready for you to move in and begin your next chapter. The kitchen is appointed with matching black appliances, offering a cohesive and functional space for culinary endeavors. The bedrooms feature warm hardwood flooring, adding a touch of classic elegance and comfort underfoot. Beyond the main living areas, a private yard provides a personal outdoor sanctuary. A billiard room, presenting an additional space for recreation and enjoyment. To truly appreciate the thoughtful design and comfortable living offered by this property, schedule your private viewing today. Hardwood floors are freshly finished. Brand new carpet in bedrooms. Master bedroom has an addition that is mutli purpose sitting room/office/nursey.
-
2026-06-15days on market $220,000 Active 36 DOM
-
2026-06-13days on market $220,000 Active 34 DOM
-
2026-06-09days on market $220,000 Active 30 DOM
-
2026-06-08days on market $220,000 Active 29 DOM
-
2026-06-07pricedays on market $220,000 Active 28 DOM
-
2026-06-04days on market $230,000 Active 25 DOM
-
2026-05-01price $230,000 893-char remark
Show marketing remark (893 chars)
Discover a lifestyle of comfort and ease at 8821 Royal Grand, a welcoming single-family residence built in 1957, located in Redford Charter Township, MI. This inviting home is ready for you to move in and begin your next chapter. The kitchen is appointed with matching black appliances, offering a cohesive and functional space for culinary endeavors. The bedrooms feature warm hardwood flooring, adding a touch of classic elegance and comfort underfoot. Beyond the main living areas, a private yard provides a personal outdoor sanctuary. A billiard room, presenting an additional space for recreation and enjoyment. To truly appreciate the thoughtful design and comfortable living offered by this property, schedule your private viewing today. Hardwood floors are freshly finished. Brand new carpet in bedrooms. Master bedroom has an addition that is mutli purpose sitting room/office/nursey.
-
2026-05-01$199,900 Active 893-char remark
Show marketing remark (893 chars)
Discover a lifestyle of comfort and ease at 8821 Royal Grand, a welcoming single-family residence built in 1957, located in Redford Charter Township, MI. This inviting home is ready for you to move in and begin your next chapter. The kitchen is appointed with matching black appliances, offering a cohesive and functional space for culinary endeavors. The bedrooms feature warm hardwood flooring, adding a touch of classic elegance and comfort underfoot. Beyond the main living areas, a private yard provides a personal outdoor sanctuary. A billiard room, presenting an additional space for recreation and enjoyment. To truly appreciate the thoughtful design and comfortable living offered by this property, schedule your private viewing today. Hardwood floors are freshly finished. Brand new carpet in bedrooms. Master bedroom has an addition that is mutli purpose sitting room/office/nursey.
-
2026-05-01$230,000 Active 893-char remark
Show marketing remark (893 chars)
Discover a lifestyle of comfort and ease at 8821 Royal Grand, a welcoming single-family residence built in 1957, located in Redford Charter Township, MI. This inviting home is ready for you to move in and begin your next chapter. The kitchen is appointed with matching black appliances, offering a cohesive and functional space for culinary endeavors. The bedrooms feature warm hardwood flooring, adding a touch of classic elegance and comfort underfoot. Beyond the main living areas, a private yard provides a personal outdoor sanctuary. A billiard room, presenting an additional space for recreation and enjoyment. To truly appreciate the thoughtful design and comfortable living offered by this property, schedule your private viewing today. Hardwood floors are freshly finished. Brand new carpet in bedrooms. Master bedroom has an addition that is mutli purpose sitting room/office/nursey.
-
1997-10-21soldstatus $96,200
ⓘ Source: listings_history table (triggers on properties + properties_extension) + one-shot
backfill from property_details.listing_events for pre-trigger history.
Tax reassessment forecast MI · Partial reset (capped growth)
- Current annual tax
- $3,440 · $287/mo
- Projected year-2 tax
- $3,440 · $287/mo
- Expected delta
- $0/yr ($0/mo · 0.0%)
ⓘ Screening estimate from a state-policy table — verify with the county assessor before closing.
Climate risk First Street
- Flood 1/10 Low FEMA zone X (unshaded) · 0% chance over 30 yrs
- Wildfire 1/10 Low
- Heat 3/10 Moderate 7 d/yr ≥98°F today · 15 d/yr by 30 yrs out
- Wind 2/10 Low
- Air quality 3/10 Moderate 2 unhealthy d/yr today · 3 by 30 yrs out
Nearby sold comps map
Loading sold comps map…
Walkable amenities ~0.75 mi
Loading nearby amenities…
Taxation est. · year 1
- Rental income
- $20,841
- − Mortgage interest
- −$12,323
- − Property taxes
- −$3,440
- − Insurance
- −$1,100
- − Repairs & maintenance
- −$1,667
- − Management
- −$1,667
- − Depreciation
- −$6,400
- Taxable loss
- −$5,757
- Est. tax savings @ 24.0%
- +$1,382
- After-tax cash flow
- $-538/yr
For passive investors: Depreciation is non-cash, so a rental often shows a tax loss while cash-flowing — sheltering income. Rental losses are passive: they offset passive income freely, and up to $25,000/yr can offset ordinary (W-2) income if you actively participate and your MAGI is under $100k (phasing out to $0 by $150k); unused losses carry forward. On sale, claimed depreciation is recaptured at up to 25%, and gains may owe capital-gains tax (a 1031 exchange can defer both). Figures are a year-1 estimate at your 24.0% rate — not tax advice; consult a CPA.
Schools (NCES district)
- District
- South Redford School District
- NCES district ID
- 2632280
- Math proficiency
- 11% ▼ -9.00%
- Reading proficiency
- 29% ▼ -7.00%
- Median HH income
- $52,775
- Composite
- 18.1/100
- National rank
- #8972
- State rank
- #455 of 540 in MI
Livability — Dearborn Heights
- Score
- 79/100
- State rank
- #82
- US rank
- #1885
Category grades
Schools grade is shown separately in the Schools card above.
Census & demographics
- County
- Wayne County · 1,562,939 people
- City population
- 61,771
- Metro
- Detroit-Warren-Dearborn, MI
- Population (ZIP)
- 36,976
- Household income
- $71,151
- Rent vs Own
- Severe rent burden
- 1052.0
Population outlook (Wayne County) Hauer SSP2
- Today (2025)
- 1,675,273 people
- By 2030
- 1,620,300 · -3.3%
- By 2040
- 1,502,341 · -10.3%
- By 2050
- 1,384,039 · -17.4%
- By 2075
- 1,124,592 · -32.9%
- By 2100
- 881,193 · -47.4%
Race, ethnicity, and origin ACS 2023
- Neighborhood character
- Majority Black (58%)
- Race & ethnicity
- Black 58% White 34% Hispanic / Latino 4% Two or more races 4%
- Common ancestry
- Romanian 7% Slovak 2% Lithuanian 2%
- Foreign-born
- 2% · Canada
- Languages at home
- 96% English-only · Spanish 1% Other Indo-European 1% Arabic 1%
Political lean MEDSL · Wayne
- 2024 margin
- Strong D (+29.0) · D 62.7% · R 33.7% · Other 3.6%
- 2008→2024 swing
- -20.5pp toward R · 2008: 49.5pp · 2024: 29.0pp
- All cycles
- 2024: D+29.0 2020: D+38.1 2016: D+37.3 2012: D+46.9 2008: D+49.5
Not yet ingested
- Civics
- —
Market trends
- HPI YoY
- ▼ -202.97%
- Current HPI
- 236.1136
- Rent YoY
- ▲ 3.25%
- Metro
- Detroit-Warren-Dearborn, MI
- State GDP YoY
- ▲ 1.37%
- F500 in state
- 28
Industry mix (Fortune 500 HQ in MI)
| Industry | F500 HQs | Revenue |
|---|---|---|
| Automotive Parts | 3 | $48B |
|
||
| Automotive | 2 | $372B |
|
||
| Chemicals | 1 | $45B |
|
||
| Automotive Retail | 1 | $29B |
|
||
| Healthcare / Medical Devices | 1 | $23B |
|
||
| Automotive Technology | 1 | $20B |
|
||
Price history
+128.7% since first listed11 events — show timeline
- 2026-06-16 Pending — MiRealSource-MiMLS
- 2026-06-16 Pending — REALCOMP
- 2026-06-05 Price Changed $220,000 MiRealSource-MiMLS
- 2026-06-04 Price Changed $220,000 REALCOMP
- 2026-06-03 Relisted — MiRealSource-MiMLS
- 2026-06-03 Relisted — REALCOMP
- 2026-05-25 Listing Removed — MiRealSource-MiMLS
- 2026-05-01 Price Changed $230,000 REALCOMP
- 2026-05-01 Listed $199,900 REALCOMP
- 2026-05-01 Listed $230,000 MiRealSource-MiMLS
- 1997-10-21 Sold (Public Records) $96,200 Public Records
Property tax history
+2.1%/yrLatest (2025): $3,440 · +2.7% YoY. Source: county tax records.
Cash-flow waterfall
monthlySold comps — $/sqft
last 12 mo · ≤1 miLoading sold comps…