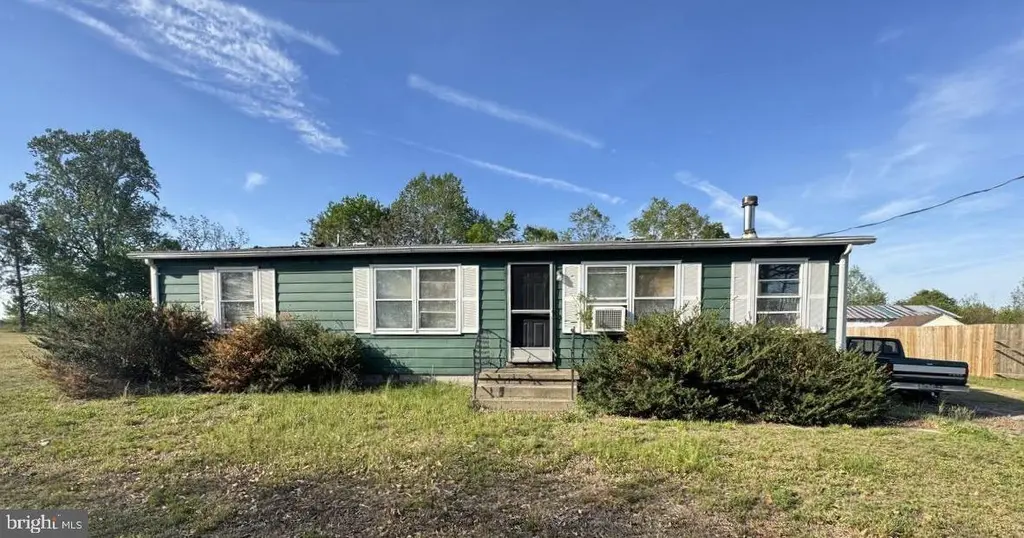
4309 Stewart Rd
Jarratt, VA 23867
$55,000B+
2 bd · 1.0 ba ·
960 sqft ·
Built 1970
· SingleFamily
· Pending
· 7 DOM
Cashflow @ list (25.0% down · 7.5%)
Estimated rent
$1,308/mo
Mortgage (P&I)
−$288
Tax + insurance
−$50
HOA
−$0
Vac / Maint / Mgmt
−$275
Net cashflow
$694/mo
Annual
$8,334/yr
Cap rate
21.44%
Cash-on-cash
54.11%
DSCR
3.41
1% rule
2.38%
Cash to close
$15,400
Investor read
- This is a 2-bed/1.0-bath single-family listed at $55k.
- At list price, monthly cash flow is $694 ($8k/yr) — positive.
- The deal already cash-flows at list — no discount required.
- Meets the 1% rule at list price ($1k rent vs $55k).
- Only 7 days on market — expect competitive offers; lowballing is unlikely to land.
- In year one you build about $3k of equity ($380 loan paydown + $3k appreciation (5.6% local appreciation)).
- Location reads 62/100 on livability (#406 in VA) — a middle-class / working-renter tenant base. Strengths: cost of living A+, housing A+; Watch: amenities F, commute F, health & safety F.
- Sussex County Public School District (rural): math 36% / reading 56% proficiency, ranked #111 of 131 in VA (top 85%) — families likely to look elsewhere, expect single-tenant / working-renter base with shorter leases; 74% free/reduced lunch — lower-income household profile, screen leases tightly.
- Zoned schools: Sussex Central Elementary (math 27% / reading 52%, grade F, #900 of 1,108 statewide, top 83%, 443 students, 101% FRL); Sussex Central Middle (math 37% / reading 52%, grade D, #278 of 342 statewide, top 82%, 236 students, 102% FRL); Sussex Central High (math 64% / reading 74%, grade B, #159 of 319 statewide, top 53%, 319 students, 101% FRL) — zoned schools average 101% FRL vs 74% district-wide (28 pts higher); higher-poverty schools than district average — tighter screening recommended.
- Market conditions: 13 active listings in the ZIP; 29 units permitted in Sussex County in 2024 (0 in 5+ unit buildings).
- Sussex County population projected at -11% by 2050 — secular population decline; favor cash flow + early exit over multi-decade hold.
- At projected returns (5.6% appreciation + 3.0% rent growth), your $15k cash investment doubles in ~2 years — after that, you're playing with house money.
- By year 9, paydown + projected appreciation supports a ~$31k cash-out refi (75% LTV) — recoverable capital for the next deal without selling this one.
- Climate carrying-cost: major wind risk, 50% chance of damaging wind over 30y; extreme-heat days projected 7→16/yr by 2055 (HVAC capex compounding) — expect insurance premiums to compound above CPI over the hold.
Questions for listing agent
- Built in 1970 — when were the roof, HVAC, electrical panel, plumbing, and water heater last replaced?
- Is there a deadline driving the sale (1031 exchange, divorce, estate, relocation)? That informs how much negotiation room exists.
- Schools are F-rated, which usually means shorter tenancies and higher turnover. Who's the typical renter profile here, and what's been the actual vacancy rate?
- What's the average days-on-market for RENTAL listings here right now (not sales)? A rising rental-DOM trend means longer vacancies and softer asking-rent achievability than the comps imply.
- What's the recent tenant-quality profile in this submarket — average credit score on applications, eviction rate, late-payment / NSF rate, and stable-employment percentage? A property-management company in the area should have these aggregated.
- How much new for-sale + rental construction is in the pipeline within 1–3 miles? Heavy new supply typically softens prices + rents 12–24 months out; constrained supply supports both.
CashFlowRE · CFR-JW4YER7GMQ4H9F
· Data 4 weeks ago
cashflowre.app · 2026-05-29