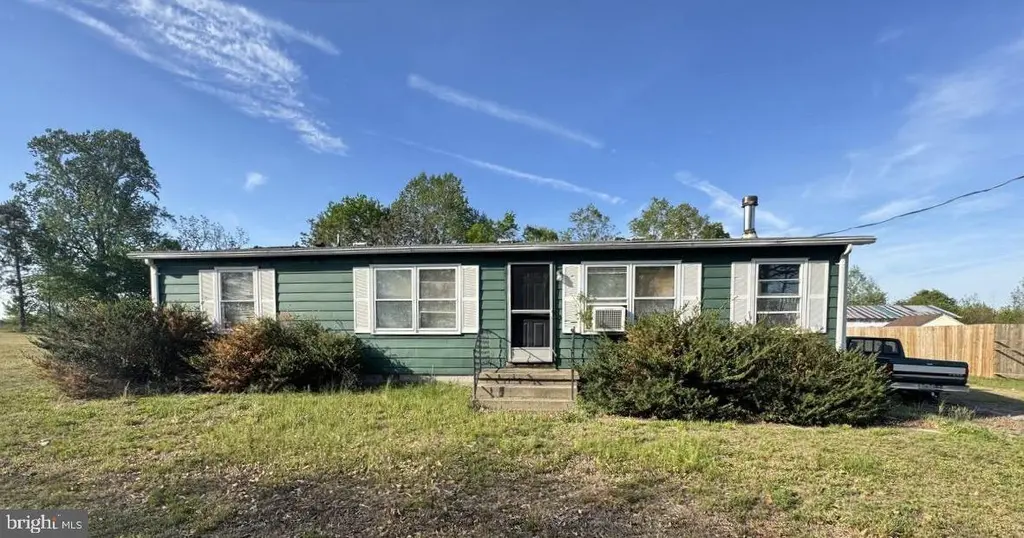
4309 Stewart Rd · Jarratt, VA
Flood risk 1/10 · Minimal
- FEMA flood zone
- X (unshaded)
- Chance of flooding over 30 yrs
- 0.0%
- Est. flood insurance / yr
- $507 – $1,088
Fire risk 3/10 · Minor
- Est. fire insurance / yr
- $666 – $1,236
Heat risk 7/10 · Major
- Hot days now (above 109°F)
- 7 days/yr
- Hot days in 30 yrs
- 16 days/yr
Wind risk 6/10 · Moderate
- Chance of severe wind over 30 yrs
- 50.0%
Air-quality risk 1/10 · Minimal
- Unhealthy air days now
- 0 days/yr
- Unhealthy air days in 30 yrs
- 0 days/yr
Risk factors via First Street. Map © Google.
Why this score? — see what drove the B+ grade
The composite is a weighted blend of 9 inputs, each scored 0–100. Each bar is that input's sub-score; the figure is the points it added to the 100-point composite (weight × sub-score).
- Cash flow +30.0/30.0
- 1% rule +10.0/10.0
- DSCR +10.0/10.0
- Appreciation +7.8/10.0
- ARV discount +5.8/15.0
- Schools +3.8/10.0
- Livability +3.1/5.0
- Rent growth +2.5/5.0
- Condition / age +2.5/5.0
$55,000
🖨 Deal sheet (PDF) 📄 Offer letter ✓ Due diligence
Listing remarks
Don’t miss this value-add opportunity at 4309 Stewart Rd in Jarratt! Perfect for investors, flippers, or landlords, this property offers strong equity potential with the right renovations. Situated on a spacious lot in a quiet setting, it’s an ideal candidate for a profitable flip or long-term rental. Sold as-is. Cash or rehab financing preferred. Bring your vision and unlock the potential—opportunities like this move fast!
Key facts
- 0.91 acre lot
- Built 1970
- Listed 7 days
Property features AI
Exterior
- Parking: Driveway
- Utilities: Public water; Public sewer; Electric hot water
- Home design: Detached structure; Above-grade living space only
- Construction: Vinyl siding; Concrete perimeter foundation; Estimated year built
- Exterior features: Outside city limits
Interior
- Bedrooms: 2 bedrooms on the main level
- Bathrooms: 1 full bathroom on the main level
- Heating & cooling: Baseboard electric heating; Wall unit cooling (electric)
- Interior features: Estimated living area; No basement
Neighborhood map
What this means for you Summary
Snapshot
- This is a 2-bed/1.0-bath single-family listed at $55k.
Deal economics
- At list price, monthly cash flow is $694 ($8k/yr) — positive.
- The deal already cash-flows at list — no discount required.
- Meets the 1% rule at list price ($1k rent vs $55k).
Location & tenants
- Location reads 62/100 on livability (#406 in VA) — a middle-class / working-renter tenant base. Strengths: cost of living A+, housing A+; Watch: amenities F, commute F, health & safety F.
- Sussex County Public School District (rural): math 36% / reading 56% proficiency, ranked #111 of 131 in VA (top 85%) — families likely to look elsewhere, expect single-tenant / working-renter base with shorter leases; 74% free/reduced lunch — lower-income household profile, screen leases tightly.
- Zoned schools: Sussex Central Elementary (math 27% / reading 52%, grade F, #900 of 1,108 statewide, top 83%, 443 students, 101% FRL); Sussex Central Middle (math 37% / reading 52%, grade D, #278 of 342 statewide, top 82%, 236 students, 102% FRL); Sussex Central High (math 64% / reading 74%, grade B, #159 of 319 statewide, top 53%, 319 students, 101% FRL) — zoned schools average 101% FRL vs 74% district-wide (28 pts higher); higher-poverty schools than district average — tighter screening recommended.
- Market conditions: 13 active listings in the ZIP; 29 units permitted in Sussex County in 2024 (0 in 5+ unit buildings).
Forward outlook
- In year one you build about $3k of equity ($380 loan paydown + $3k appreciation (5.6% local appreciation)).
- Sussex County population projected at -11% by 2050 — secular population decline; favor cash flow + early exit over multi-decade hold.
- At projected returns (5.6% appreciation + 3.0% rent growth), your $15k cash investment doubles in ~2 years — after that, you're playing with house money.
- By year 9, paydown + projected appreciation supports a ~$31k cash-out refi (75% LTV) — recoverable capital for the next deal without selling this one.
Negotiation context
- Only 7 days on market — expect competitive offers; lowballing is unlikely to land.
Risks & watch-outs
- Climate carrying-cost: major wind risk, 50% chance of damaging wind over 30y; extreme-heat days projected 7→16/yr by 2055 (HVAC capex compounding) — expect insurance premiums to compound above CPI over the hold.
Questions for the listing agent
- Built in 1970 — when were the roof, HVAC, electrical panel, plumbing, and water heater last replaced?
- Is there a deadline driving the sale (1031 exchange, divorce, estate, relocation)? That informs how much negotiation room exists.
- Schools are F-rated, which usually means shorter tenancies and higher turnover. Who's the typical renter profile here, and what's been the actual vacancy rate?
- What's the average days-on-market for RENTAL listings here right now (not sales)? A rising rental-DOM trend means longer vacancies and softer asking-rent achievability than the comps imply.
- What's the recent tenant-quality profile in this submarket — average credit score on applications, eviction rate, late-payment / NSF rate, and stable-employment percentage? A property-management company in the area should have these aggregated.
- How much new for-sale + rental construction is in the pipeline within 1–3 miles? Heavy new supply typically softens prices + rents 12–24 months out; constrained supply supports both.
Investment metrics
- 1% rule
- 2.38% ✓
- Cap rate
- 21.44%
- Cash-on-cash
- 54.11%
- DSCR
- 3.41
- GRM
- 3.5
CMA / ARV
- ARV (median comp)
- $53,000
- List price
- $55,000
- Delta
- 3.77%
- Verdict
- FAIR
- Comps
- 1 within 2.0 mi
Show comp detail 1 sale within ~0.75 mi
| Address | Dist | Beds/Ba | Sqft | Sold | Price | $/sf | Match |
|---|---|---|---|---|---|---|---|
| 4309 Stewart Rd | 0.00mi | 2/1.0 | 960 (0%) | 1mo | $53,000 | $55 | 100 |
Match score weights: distance 35% · size 25% · config 20% · recency 20%. Top-matched comps best support the ARV.
Projected returns pro-forma
5.57% appreciation · 3.0% rent growth · sell at horizon
- IRR
- 62.1%
- Equity multiple
- 4.81×
- Total profit
- $58,718
- Equity at exit
- $33,100
- IRR
- 59.4%
- Equity multiple
- 9.99×
- Total profit
- $138,475
- Equity at exit
- $58,792
Cash invested: $15,400 (down + closing). Projections, not guarantees.
Landlord ↔ Tenant lean methodology
- Overall (STATE)
- 55 Moderately Landlord-Leaning
- State Virginia
- 55 Moderately Landlord-Leaning · D+2
- County
- — inherits STATE
- City
- — inherits STATE
ZIP-level market 23867
- Home prices YoY
- 2.9%
- Active inventory
- 13
- Price-to-rent
- 3.5×
Monthly cashflow live
- Estimated rent
- $1,308 medium interval (Pro) →
- Mortgage (P&I)
- −$288
- Tax from tax record
- −$27 /mo · $327/yr
- Insurance
- −$23
- HOA
- −$0
- Vacancy / Maint / Mgmt
- −$275
- Net cashflow
- $694
Break-even live
Sensitivity live
| Price | -10% $726 | -5% $710 | +0% $694 | +5% $679 | +10% $663 |
|---|---|---|---|---|---|
| Rent | -10% $591 | -5% $643 | +0% $694 | +5% $746 | +10% $798 |
| Rate | -1.0pp $722 | -0.5pp $708 | base $694 | +0.5pp $680 | +1.0pp $666 |
UW: 25.0% down · 7.5% · 30yr · 1.5% tax · 5.0% vac · 8.0% maint · 8.0% mgmt
Financing live
Cash to close
- Down payment
- $13,750
- Closing costs
- $1,650
- Reserves months
- —
- Total cash needed
- —
Loan-product check · same deal, 3 products live
Conventional
25% down · 7.5% · 30yr
- Down + closing
- —
- Monthly P&I
- —
- Monthly cashflow
- —
- DSCR
- —
- Eligible?
- —
Personal DTI + credit; lowest rate.
DSCR
20% down · 8.5% · 30yr
- Down + closing
- —
- Monthly P&I
- —
- Monthly cashflow
- —
- DSCR
- —
- Eligible?
- —
No personal income docs; deal must DSCR.
Hard money
10% down · 12.0% · 12mo
- Down + closing
- —
- Monthly P&I
- —
- Monthly cashflow
- —
- DSCR
- —
- Eligible?
- —
Short-term bridge; refi at stabilization.
Listing history 2 events
-
2026-05-11status Pending 445-char remark
-
2026-05-04$55,000 Active 445-char remark
ⓘ Source: listings_history table (triggers on properties + properties_extension) + one-shot
backfill from property_details.listing_events for pre-trigger history.
Tax reassessment forecast VA · Resets to sale price
- Current annual tax
- $327 · $27/mo
- Projected year-2 tax
- $451 · $38/mo
- Expected delta
- +$124/yr (+$10/mo · 37.9%)
ⓘ Screening estimate from a state-policy table — verify with the county assessor before closing.
Climate risk First Street
- Flood 1/10 Low FEMA zone X (unshaded) · 0% chance over 30 yrs
- Wildfire 3/10 Moderate
- Heat 7/10 Severe 7 d/yr ≥109°F today · 16 d/yr by 30 yrs out
- Wind 6/10 Major 50% chance of damaging wind over 30 yrs
- Air quality 1/10 Low 0 unhealthy d/yr today · 0 by 30 yrs out
Nearby sold comps map
Loading sold comps map…
Walkable amenities ~0.75 mi
Loading nearby amenities…
Taxation est. · year 1
- Rental income
- $15,692
- − Mortgage interest
- −$3,081
- − Property taxes
- −$327
- − Insurance
- −$275
- − Repairs & maintenance
- −$1,255
- − Management
- −$1,255
- − Depreciation
- −$1,600
- Taxable income
- $7,898
- Est. tax owed @ 24.0%
- −$1,896
- After-tax cash flow
- $6,438/yr
For passive investors: Depreciation is non-cash, so a rental often shows a tax loss while cash-flowing — sheltering income. Rental losses are passive: they offset passive income freely, and up to $25,000/yr can offset ordinary (W-2) income if you actively participate and your MAGI is under $100k (phasing out to $0 by $150k); unused losses carry forward. On sale, claimed depreciation is recaptured at up to 25%, and gains may owe capital-gains tax (a 1031 exchange can defer both). Figures are a year-1 estimate at your 24.0% rate — not tax advice; consult a CPA.
Schools (NCES district)
- District
- Sussex County Public School District
- NCES district ID
- 5103780
- Math proficiency
- 36% ▼ -46.00%
- Reading proficiency
- 56% ▼ -22.00%
- Median HH income
- $40,095
- Composite
- 38.44/100
- National rank
- #4198
- State rank
- #111 of 131 in VA
Livability — Jarratt
- Score
- 62/100
- State rank
- #406
- US rank
- #16968
Category grades
Schools grade is shown separately in the Schools card above.
Census & demographics
- Population (ZIP)
- 4,924
Population outlook (Sussex County) Hauer SSP2
- Today (2025)
- 11,207 people
- By 2030
- 10,897 · -2.8%
- By 2040
- 10,451 · -6.7%
- By 2050
- 9,936 · -11.3%
- By 2075
- 8,643 · -22.9%
- By 2100
- 6,908 · -38.4%
Race, ethnicity, and origin ACS 2023
- Neighborhood character
- Diverse neighborhood (Simpson 0.62)
- Race & ethnicity
- Black 46% White 39% Two or more races 8% Hispanic / Latino 8%
- Hispanic origin (detail)
- Mexican 2% Puerto Rican 3%
- Common ancestry
- Serbian 2% Slovak 1% Italian 1%
- Foreign-born
- 3% · Canada
- Languages at home
- 95% English-only · Spanish 4%
Political lean MEDSL · Sussex
- 2024 margin
- Toss-up / Even · D 51.9% · R 47.5%
- 2008→2024 swing
- -19.3pp toward R · 2008: 23.8pp · 2024: 4.4pp
- All cycles
- 2024: D+4.4 2020: D+11.9 2016: D+16.3 2012: D+24.5 2008: D+23.8
Not yet ingested
- Civics
- —
Market trends
- HPI YoY
- ▲ 5.57%
- Current HPI
- 201.2897
- Rent YoY
- —
- Metro
- —
- State GDP YoY
- ▲ 2.40%
- F500 in state
- 50
Industry mix (Fortune 500 HQ in VA)
| Industry | F500 HQs | Revenue |
|---|---|---|
| Aerospace / Defense | 4 | $236B |
|
||
| Technology / Defense | 3 | $32B |
|
||
| Financial Services | 2 | $176B |
|
||
| Utilities | 2 | $27B |
|
||
| Insurance | 2 | $25B |
|
||
| Technology | 2 | $15B |
|
||
Price history
-3.6% since first listed3 events — show timeline
- 2026-06-05 Sold (MLS) $53,000 BRIGHT MLS
- 2026-05-11 Pending — BRIGHT MLS
- 2026-05-04 Listed $55,000 BRIGHT MLS
Property tax history
+3.6%/yrLatest (2025): $327 · +0.0% YoY. Source: county tax records.
Cash-flow waterfall
monthlySold comps — $/sqft
last 12 mo · ≤1 miLoading sold comps…