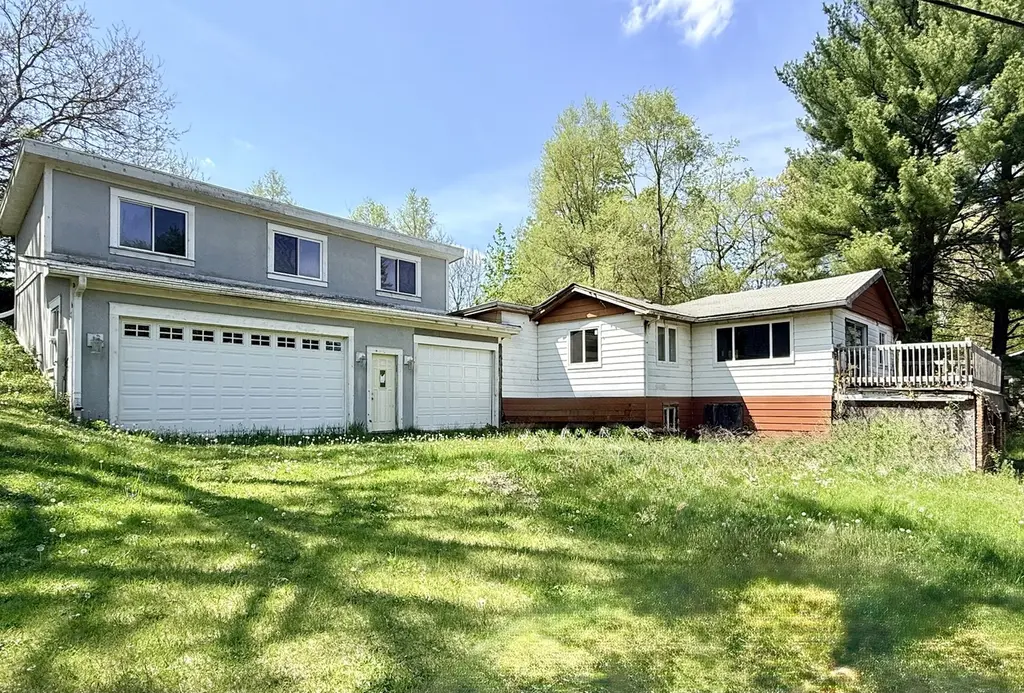
4923 W Wonder Lake Dr
Wonder Lake, IL 60097
$200,000B-
3 bd · 1.0 ba ·
1,414 sqft ·
Built 1942
· SingleFamily
· Active
· 24 DOM
Cashflow @ list (25.0% down · 7.5%)
Estimated rent
$2,292/mo
Mortgage (P&I)
−$1,049
Tax + insurance
−$320
HOA
−$0
Vac / Maint / Mgmt
−$481
Net cashflow
$441/mo
Annual
$5,296/yr
Cap rate
8.94%
Cash-on-cash
9.46%
DSCR
1.42
1% rule
1.15%
Cash to close
$56,000
Investor read
- This is a 3-bed/1.0-bath single-family listed at $200k.
- At list price, monthly cash flow is $441 ($5k/yr) — positive.
- The deal already cash-flows at list — no discount required.
- Meets the 1% rule at list price ($2k rent vs $200k).
- It's been on market 24 days — a 2% lower offer ($197k) is reasonable based on typical stale-listing flexibility.
- Recommended offer: $197k (1.5% below list) — sets the bar for market timing.
- Local home prices are declining (-3.0%/yr); year-one equity from $1k of loan paydown is wiped out by about $6k of value loss. Plan a longer hold.
- Location reads 69/100 on livability (#403 in IL) — a middle-class / working-renter tenant base. Strengths: crime A+, employment A+, cost of living A+; Watch: amenities F, commute F, health & safety F.
- Woodstock CUSD 200 (town): math 24% / reading 38% proficiency, ranked #220 of 620 in IL (top 36%) — families likely to look elsewhere, expect single-tenant / working-renter base with shorter leases.
- Zoned schools: Greenwood Elem School (math 17% / reading 32%, grade F, #850 of 2,056 statewide, top 45%, 293 students, 0% FRL); Northwood Middle School (math 18% / reading 41%, grade F, #256 of 665 statewide, top 41%, 626 students, 0% FRL); Woodstock High School (math 28% / reading 40%, grade F, #147 of 693 statewide, top 22%, 1,021 students, 0% FRL) — zoned schools average 0% FRL vs 36% district-wide (36 pts lower); this property's tenant base skews higher-income than the district average.
- Watch-outs: built in 1942 — expect roof / HVAC / electrical / plumbing capex.
- Market conditions: 126 active listings in the ZIP; 3 comparable units currently listed for rent nearby; rentals leasing fast (median 0d on market — plan ~1-2 weeks tenant-placement turnaround); 1,595 units permitted in McHenry County in 2024 (485 in 5+ unit buildings).
- McHenry County population projected at -12% by 2050 — secular population decline; favor cash flow + early exit over multi-decade hold.
- 3 sale attempts since 13y ago with the ask held roughly flat each time — persistent listings suggest the price (not the market) is what's stuck; bring a comps-based counter.
- Current owner paid $50k; list at $200k implies a 300% gain — meaningful room to come down on a strong offer.
- Cap rate 8.9% vs local median 3.6% in Wonder Lake — top-decile yield for the area; either an underpriced asset or a hidden risk that comps aren't pricing in. Stress-test before assuming the spread holds.
Questions for listing agent
- Built in 1942 — when were the roof, HVAC, electrical panel, plumbing, and water heater last replaced?
- Is there a deadline driving the sale (1031 exchange, divorce, estate, relocation)? That informs how much negotiation room exists.
- Schools are F-rated, which usually means shorter tenancies and higher turnover. Who's the typical renter profile here, and what's been the actual vacancy rate?
- What's the average days-on-market for RENTAL listings here right now (not sales)? A rising rental-DOM trend means longer vacancies and softer asking-rent achievability than the comps imply.
- What's the recent tenant-quality profile in this submarket — average credit score on applications, eviction rate, late-payment / NSF rate, and stable-employment percentage? A property-management company in the area should have these aggregated.
- How much new for-sale + rental construction is in the pipeline within 1–3 miles? Heavy new supply typically softens prices + rents 12–24 months out; constrained supply supports both.
CashFlowRE · CFR-JYG09EAZ56C0BJ
· Data 20 h ago
cashflowre.app · 2026-05-29