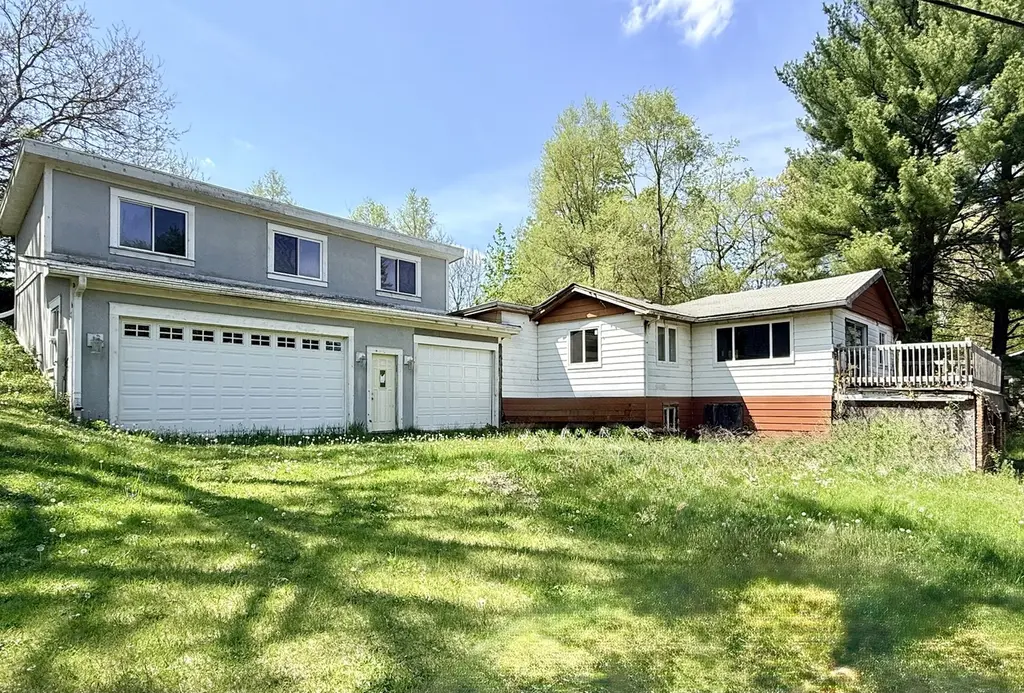
4923 W Wonder Lake Dr · Wonder Lake, IL
Flood risk 1/10 · Minimal
- FEMA flood zone
- X (unshaded)
- Chance of flooding over 30 yrs
- 0.0%
- Est. flood insurance / yr
- $473 – $860
Fire risk 1/10 · Minimal
- Est. fire insurance / yr
- $804 – $1,492
Heat risk 2/10 · Minimal
- Hot days now (above 101°F)
- 7 days/yr
- Hot days in 30 yrs
- 14 days/yr
Wind risk 2/10 · Minimal
- Chance of severe wind over 30 yrs
- —
Air-quality risk 2/10 · Minimal
- Unhealthy air days now
- 0 days/yr
- Unhealthy air days in 30 yrs
- 1 days/yr
Risk factors via First Street. Map © Google.
Why this score? — see what drove the B- grade
The composite is a weighted blend of 9 inputs, each scored 0–100. Each bar is that input's sub-score; the figure is the points it added to the 100-point composite (weight × sub-score).
- Cash flow +25.1/30.0
- ARV discount +15.0/15.0
- DSCR +8.2/10.0
- 1% rule +6.5/10.0
- Livability +3.5/5.0
- Schools +2.8/10.0
- Rent growth +2.5/5.0
- Condition / age +2.5/5.0
- Appreciation +0.0/10.0
$200,000
🖨 Deal sheet (PDF) 📄 Offer letter ✓ Due diligence
Listing remarks
Endless Potential! Bring your vision to life with this 3-bedroom, 1-bath home that's primed and ready for your finishing touches! Much of the heavy lifting has already begun, offering a fantastic head start. Even better? Brand-new, still-in-the-box refrigerator, new stove, flooring, and countertops, are all included with the sale, saving you money in material costs. The real showstopper is the massive 2-car garage. Featuring a framed-out upper level, this space is a blank canvas perfect for a lucrative rental unit, a private home office, or a creative studio. Don't miss this incredible opportunity to build instant equity and design your dream space! The view across the street of the bay i
Key facts
- New stove
- New siding
- New flooring
Tags
Property features AI
Finance
- Financial info: Special service area: Yes
- HOA & community: No master association fee required
Exterior
- Parking: Attached garage (4 garage spaces, 4 total parking spaces)
- Utilities: Public water; Septic tank sewer
- Home design: Detached single-family home; Built approximately 71–80 years ago; Property is fee simple ownership
- Construction: Aluminum siding, vinyl siding and brick exterior
- Exterior features: Lot approximately 0.25–0.49 acre; Lot dimensions about 100 x 119
Interior
- Kitchen: Kitchen on the main level (approx. 17 x 12)
- Bedrooms: Three bedrooms (all on the main level); Master bedroom on the main level (approx. 14 x 12); Two additional main-level bedrooms (each approx. 12 x 10)
- Bathrooms: One full bathroom
- Heating & cooling: Natural gas forced-air heating; Central air conditioning
- Interior features: Six total rooms; Unfinished full basement
- Laundry & utility: Dedicated laundry room
Neighborhood map
What this means for you Summary
Snapshot
- This is a 3-bed/1.0-bath single-family listed at $200k.
Deal economics
- At list price, monthly cash flow is $441 ($5k/yr) — positive.
- The deal already cash-flows at list — no discount required.
- Meets the 1% rule at list price ($2k rent vs $200k).
- Recommended offer: $197k (1.5% below list) — sets the bar for market timing.
- Cap rate 8.9% vs local median 3.6% in Wonder Lake — top-decile yield for the area; either an underpriced asset or a hidden risk that comps aren't pricing in. Stress-test before assuming the spread holds.
Location & tenants
- Location reads 69/100 on livability (#403 in IL) — a middle-class / working-renter tenant base. Strengths: crime A+, employment A+, cost of living A+; Watch: amenities F, commute F, health & safety F.
- Woodstock CUSD 200 (town): math 24% / reading 38% proficiency, ranked #220 of 620 in IL (top 36%) — families likely to look elsewhere, expect single-tenant / working-renter base with shorter leases.
- Zoned schools: Greenwood Elem School (math 17% / reading 32%, grade F, #850 of 2,056 statewide, top 45%, 293 students, 0% FRL); Northwood Middle School (math 18% / reading 41%, grade F, #256 of 665 statewide, top 41%, 626 students, 0% FRL); Woodstock High School (math 28% / reading 40%, grade F, #147 of 693 statewide, top 22%, 1,021 students, 0% FRL) — zoned schools average 0% FRL vs 36% district-wide (36 pts lower); this property's tenant base skews higher-income than the district average.
- Market conditions: 126 active listings in the ZIP; 3 comparable units currently listed for rent nearby; rentals leasing fast (median 0d on market — plan ~1-2 weeks tenant-placement turnaround); 1,595 units permitted in McHenry County in 2024 (485 in 5+ unit buildings).
Forward outlook
- Local home prices are declining (-3.0%/yr); year-one equity from $1k of loan paydown is wiped out by about $6k of value loss. Plan a longer hold.
- McHenry County population projected at -12% by 2050 — secular population decline; favor cash flow + early exit over multi-decade hold.
Negotiation context
- It's been on market 24 days — a 2% lower offer ($197k) is reasonable based on typical stale-listing flexibility.
- 3 sale attempts since 13y ago with the ask held roughly flat each time — persistent listings suggest the price (not the market) is what's stuck; bring a comps-based counter.
- Current owner paid $50k; list at $200k implies a 300% gain — meaningful room to come down on a strong offer.
Risks & watch-outs
- Watch-outs: built in 1942 — expect roof / HVAC / electrical / plumbing capex.
Questions for the listing agent
- Built in 1942 — when were the roof, HVAC, electrical panel, plumbing, and water heater last replaced?
- Is there a deadline driving the sale (1031 exchange, divorce, estate, relocation)? That informs how much negotiation room exists.
- Schools are F-rated, which usually means shorter tenancies and higher turnover. Who's the typical renter profile here, and what's been the actual vacancy rate?
- What's the average days-on-market for RENTAL listings here right now (not sales)? A rising rental-DOM trend means longer vacancies and softer asking-rent achievability than the comps imply.
- What's the recent tenant-quality profile in this submarket — average credit score on applications, eviction rate, late-payment / NSF rate, and stable-employment percentage? A property-management company in the area should have these aggregated.
- How much new for-sale + rental construction is in the pipeline within 1–3 miles? Heavy new supply typically softens prices + rents 12–24 months out; constrained supply supports both.
Investment metrics
- 1% rule
- 1.15% ✓
- Cap rate
- 8.94%
- Cash-on-cash
- 9.46%
- DSCR
- 1.42
- GRM
- 7.3
CMA / ARV
- ARV (on-the-fly)
- $270,074
- Comps found
- 12
Show comp detail 12 sales within ~0.75 mi
| Address | Dist | Beds/Ba | Sqft | Sold | Price | $/sf | Match |
|---|---|---|---|---|---|---|---|
| 5116 Willow Dr | 0.24mi | 3/1.0 | 1,325 (-6%) | 1mo | $155,000 | $117 | 77 |
| 5111 Wonder Woods Dr | 0.19mi | 3/2.0 | 1,456 (+3%) | 7mo | $258,000 | $177 | 76 |
| 4523 W Lake Shore Dr | 0.39mi | 3/1.0 | 1,422 (+1%) | 18mo | $210,000 | $148 | 66 |
| 4725 Winnebago Dr | 0.50mi | 3/3.5 | 1,412 (-0%) | 10mo | $351,000 | $249 | 58 |
| 7509 Marblehead Rd | 0.53mi | 3/2.0 | 1,580 (+12%) | 1mo | $275,000 | $174 | 51 |
| 4717 Winnebago Dr | 0.51mi | 3/1.5 | 1,224 (-13%) | 2mo | $252,500 | $206 | 50 |
| 5016 W Wonder Lake Dr | 0.14mi | 4/2.0 (+1) | 1,272 (-10%) | 22mo | $249,000 | $196 | 49 |
| 4507 E Wonder Lake Rd | 0.65mi | 3/2.0 | 1,300 (-8%) | 6mo | $245,111 | $189 | 48 |
| 7526 Salem Rd | 0.48mi | 2/1.0 (-1) | 1,212 (-14%) | 5mo | $255,000 | $210 | 45 |
| 7506 Salem Rd | 0.55mi | 2/1.0 (-1) | 1,222 (-14%) | 8mo | $233,500 | $191 | 40 |
| 5535 Wonder Woods Dr | 0.69mi | 3/1.0 | 1,238 (-12%) | 9mo | $262,000 | $212 | 40 |
| 4810 Hilltop Dr | 0.60mi | 3/1.5 | 1,228 (-13%) | 20mo | $225,000 | $183 | 32 |
Match score weights: distance 35% · size 25% · config 20% · recency 20%. Top-matched comps best support the ARV.
Projected returns pro-forma
-3.0% appreciation · 3.0% rent growth · sell at horizon
- IRR
- -2.0%
- Equity multiple
- 0.92×
- Total profit
- $-4,271
- Equity at exit
- $29,821
- IRR
- 7.7%
- Equity multiple
- 1.58×
- Total profit
- $32,586
- Equity at exit
- $17,292
Cash invested: $56,000 (down + closing). Projections, not guarantees.
Landlord ↔ Tenant lean methodology
- Overall (STATE)
- 43 Moderately Tenant-Leaning
- State Illinois
- 43 Moderately Tenant-Leaning · D+7
- County
- — inherits STATE
- City
- — inherits STATE
ZIP-level market 60097
- Home prices YoY
- -34.1%
- Active inventory
- 126
- Price-to-rent
- 7.3×
Monthly cashflow live
- Estimated rent
- $2,292 medium interval (Pro) →
- Mortgage (P&I)
- −$1,049
- Tax from tax record
- −$237 /mo · $2,845/yr
- Insurance
- −$83
- HOA
- −$0
- Vacancy / Maint / Mgmt
- −$481
- Net cashflow
- $441
Break-even live
Sensitivity live
| Price | -10% $555 | -5% $498 | +0% $441 | +5% $385 | +10% $328 |
|---|---|---|---|---|---|
| Rent | -10% $260 | -5% $351 | +0% $441 | +5% $532 | +10% $622 |
| Rate | -1.0pp $542 | -0.5pp $492 | base $441 | +0.5pp $390 | +1.0pp $337 |
UW: 25.0% down · 7.5% · 30yr · 1.5% tax · 5.0% vac · 8.0% maint · 8.0% mgmt
Financing live
Cash to close
- Down payment
- $50,000
- Closing costs
- $6,000
- Reserves months
- —
- Total cash needed
- —
Loan-product check · same deal, 3 products live
Conventional
25% down · 7.5% · 30yr
- Down + closing
- —
- Monthly P&I
- —
- Monthly cashflow
- —
- DSCR
- —
- Eligible?
- —
Personal DTI + credit; lowest rate.
DSCR
20% down · 8.5% · 30yr
- Down + closing
- —
- Monthly P&I
- —
- Monthly cashflow
- —
- DSCR
- —
- Eligible?
- —
No personal income docs; deal must DSCR.
Hard money
10% down · 12.0% · 12mo
- Down + closing
- —
- Monthly P&I
- —
- Monthly cashflow
- —
- DSCR
- —
- Eligible?
- —
Short-term bridge; refi at stabilization.
Rent comps 3 comps
| Address | Beds | Baths | Sqft | Rent | $/sqft | DOM | Units | Dist |
|---|---|---|---|---|---|---|---|---|
| 8420 Stillwater Rd Wonder Lake, IL | 2.0 | 2.5 | 1558 | $2,300 | $1.48 | 0d | 1 | 0.49mi |
| 8533 Stillwater Rd Wonder Lake, IL | 3.0 | 2.5 | 1760 | $2,400 | $1.36 | 0d | 1 | 0.58mi |
| 5412 E Wonder Lake Rd Wonder Lake, IL | 4.0 | 2.0 | 1868 | $2,100 | $1.12 | 21d | 1 | 0.89mi |
Listing history 20 events
-
2026-06-21days on market $200,000 Active 24 DOM
-
2026-06-18days on market $200,000 Active 21 DOM
-
2026-06-17days on market $200,000 Active 20 DOM
-
2026-06-16days on market $200,000 Active 19 DOM
-
2026-06-15days on market $200,000 Active 18 DOM
-
2026-06-13days on market $200,000 Active 16 DOM
-
2026-06-09days on market $200,000 Active 12 DOM
-
2026-06-08days on market $200,000 Active 11 DOM
-
2026-06-08days on market $200,000 Active 10 DOM
-
2026-06-04days on market $200,000 Active 7 DOM
-
2026-06-03days on market $200,000 Active 6 DOM
-
2026-06-02days on market $200,000 Active 5 DOM
-
2026-06-01days on market $200,000 Active 4 DOM
-
2026-05-31days on market $200,000 Active 3 DOM
-
2026-05-28$200,000 Active
-
2016-05-03soldstatus $50,000
-
2014-04-14historical
-
2013-07-09New
-
2013-05-15historical
-
2013-03-12New
ⓘ Source: listings_history table (triggers on properties + properties_extension) + one-shot
backfill from property_details.listing_events for pre-trigger history.
Tax reassessment forecast IL · Partial reset (capped growth)
- Current annual tax
- $2,845 · $237/mo
- Projected year-2 tax
- $3,693 · $308/mo
- Expected delta
- +$847/yr (+$71/mo · 29.8%)
ⓘ Screening estimate from a state-policy table — verify with the county assessor before closing.
Climate risk First Street
- Flood 1/10 Low FEMA zone X (unshaded) · 0% chance over 30 yrs
- Wildfire 1/10 Low
- Heat 2/10 Low 7 d/yr ≥101°F today · 14 d/yr by 30 yrs out
- Wind 2/10 Low
- Air quality 2/10 Low 0 unhealthy d/yr today · 1 by 30 yrs out
Nearby sold comps map
Loading sold comps map…
Walkable amenities ~0.75 mi
Loading nearby amenities…
Taxation est. · year 1
- Rental income
- $27,503
- − Mortgage interest
- −$11,203
- − Property taxes
- −$2,845
- − Insurance
- −$1,000
- − Repairs & maintenance
- −$2,200
- − Management
- −$2,200
- − Depreciation
- −$5,818
- Taxable income
- $2,236
- Est. tax owed @ 24.0%
- −$537
- After-tax cash flow
- $4,760/yr
For passive investors: Depreciation is non-cash, so a rental often shows a tax loss while cash-flowing — sheltering income. Rental losses are passive: they offset passive income freely, and up to $25,000/yr can offset ordinary (W-2) income if you actively participate and your MAGI is under $100k (phasing out to $0 by $150k); unused losses carry forward. On sale, claimed depreciation is recaptured at up to 25%, and gains may owe capital-gains tax (a 1031 exchange can defer both). Figures are a year-1 estimate at your 24.0% rate — not tax advice; consult a CPA.
Schools (NCES district)
- District
- Woodstock CUSD 200
- NCES district ID
- 1743330
- Math proficiency
- 24% ▼ -8.00%
- Reading proficiency
- 38% ▼ -8.00%
- Median HH income
- $64,309
- Composite
- 28.35/100
- National rank
- #6773
- State rank
- #220 of 620 in IL
Livability — Wonder Lake
- Score
- 69/100
- State rank
- #403
- US rank
- #8372
Category grades
Schools grade is shown separately in the Schools card above.
Census & demographics
- Census place
- Wonder Lake, IL
- City population
- 11,481
- Population (ZIP)
- 11,481
Population outlook (McHenry County) Hauer SSP2
- Today (2025)
- 305,342 people
- By 2030
- 301,491 · -1.3%
- By 2040
- 288,211 · -5.6%
- By 2050
- 268,430 · -12.1%
- By 2075
- 226,209 · -25.9%
- By 2100
- 181,247 · -40.6%
Race, ethnicity, and origin ACS 2023
- Neighborhood character
- Predominantly White (74%)
- Race & ethnicity
- White 74% Hispanic / Latino 21% Two or more races 13%
- Hispanic origin (detail)
- Mexican 18% Puerto Rican 1%
- Common ancestry
- Romanian 10% Portuguese 4% Lithuanian 3%
- Foreign-born
- 5% · Canada
- Languages at home
- 88% English-only · Spanish 11% Other Indo-European 1%
Political lean MEDSL · McHenry
- 2024 margin
- Lean R (+5.3) · D 46.6% · R 51.9% · Other 1.5%
- 2008→2024 swing
- -10.6pp toward R · 2008: 5.3pp · 2024: -5.3pp
- All cycles
- 2024: R+5.3 2020: R+2.5 2016: R+8.1 2012: R+8.8 2008: D+5.3
Not yet ingested
- Civics
- —
Market trends
- HPI YoY
- ▼ -117.25%
- Current HPI
- 226.1109
- Rent YoY
- —
- Metro
- —
- State GDP YoY
- ▲ 1.59%
- F500 in state
- 60
Industry mix (Fortune 500 HQ in IL)
| Industry | F500 HQs | Revenue |
|---|---|---|
| Insurance | 4 | $201B |
|
||
| Consumer Goods | 4 | $87B |
|
||
| Industrial Machinery | 3 | $64B |
|
||
| Healthcare | 2 | $55B |
|
||
| Retail / Pharmacy | 1 | $148B |
|
||
| Agriculture / Food | 1 | $86B |
|
||
Price history
+300.0% since first listed6 events — show timeline
- 2026-05-28 Listed $200,000 MRED as Distributed by MLS Grid
- 2016-05-03 Sold (Public Records) $50,000 Public Records
- 2014-04-14 Listing Removed — MRED as Distributed by MLS Grid
- 2013-07-09 Listed — MRED as Distributed by MLS Grid
- 2013-05-15 Listing Removed — MRED as Distributed by MLS Grid
- 2013-03-12 Listed — MRED as Distributed by MLS Grid
Property tax history
-2.6%/yrLatest (2024): $2,845 · +3.0% YoY. Source: county tax records.
Cash-flow waterfall
monthlySold comps — $/sqft
last 12 mo · ≤1 miLoading sold comps…