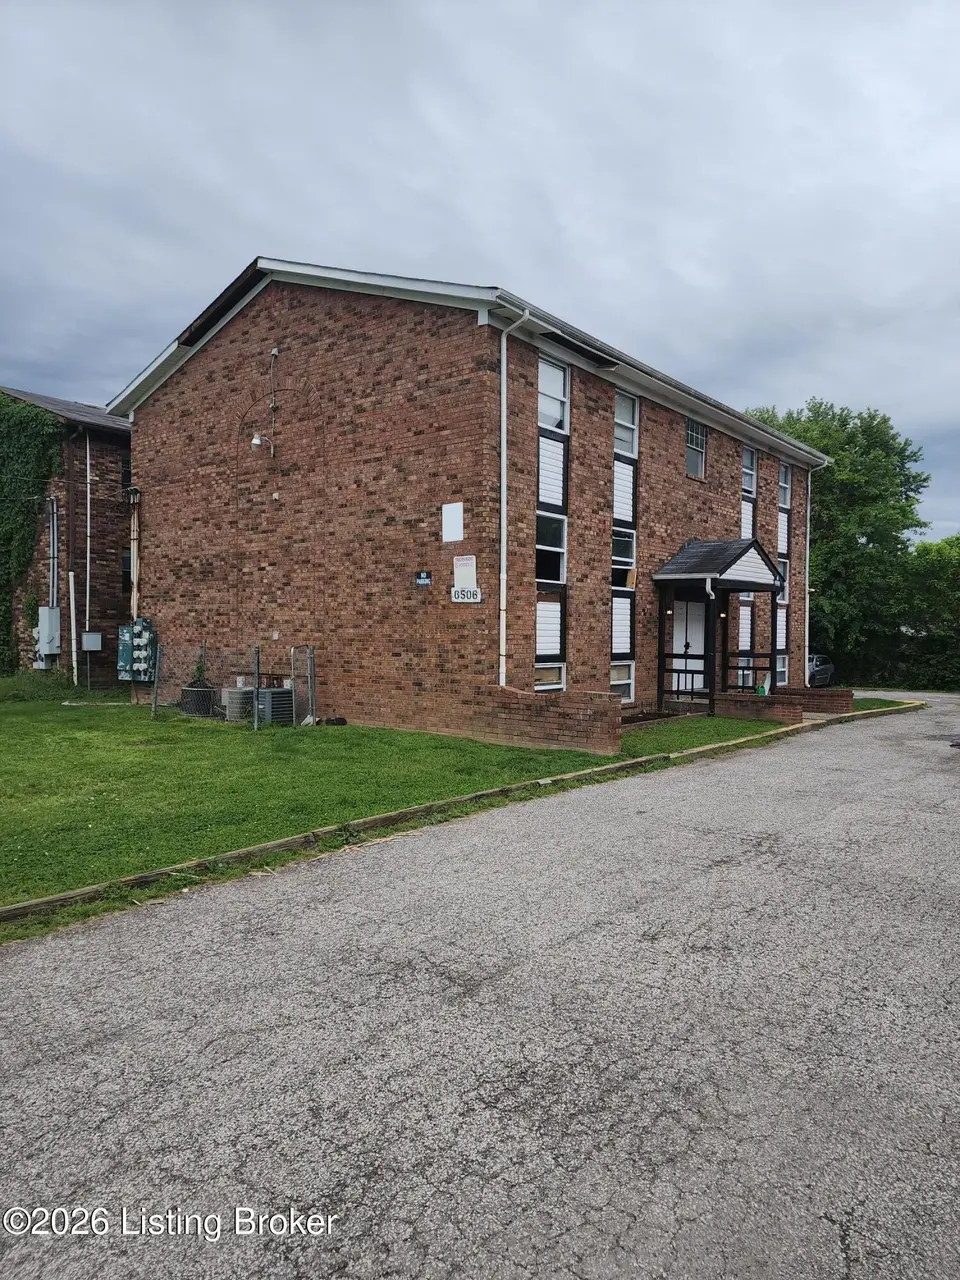
6506 Hackel Dr
Louisville/Jefferson County metro government (balance), KY 40258
$415,900B-
12 bd · 6.0 ba ·
3,430 sqft ·
Built 1975
· MultiFamily
· Active
· 35 DOM
Cashflow @ list (25.0% down · 7.5%)
Estimated rent
$6,527/mo
Mortgage (P&I)
−$2,181
Tax + insurance
−$573
HOA
−$0
Vac / Maint / Mgmt
−$1,371
Net cashflow
$2,403/mo
Annual
$28,832/yr
Cap rate
13.23%
Cash-on-cash
24.76%
DSCR
2.10
1% rule
1.57%
Cash to close
$116,452
Investor read
- This is a 6 × 2.0-bed/1.0-bath units multifamily listed at $416k.
- At list price, monthly cash flow is $2k ($29k/yr) — positive. Per door: $400/mo.
- The deal already cash-flows at list — no discount required.
- Meets the 1% rule at list price ($7k rent vs $416k).
- It's been on market 35 days — a 3% lower offer ($403k) is reasonable based on typical stale-listing flexibility.
- Recommended offer: $403k (3.0% below list) — sets the bar for market timing.
- Local home prices are declining (-3.0%/yr); year-one equity from $3k of loan paydown is wiped out by about $12k of value loss. Plan a longer hold.
- Location reads: area grade B — affects rentability + tenant quality, not the cash-flow math above.
- Jefferson County (urban): math 19% / reading 35% proficiency, ranked #121 of 165 in KY (top 73%) — low school quality limits family demand, transient renter base, plan for 1-2y turnover.
- Market conditions: Rents flat; 122 active listings in the ZIP; 2,836 units permitted in Jefferson County in 2024 (1,558 in 5+ unit buildings).
- Jefferson County population projected at +13% by 2050 — modest demand growth; plan on rents tracking national, not racing it.
- 7 sale attempts since 25y ago; this cycle's ask has dropped $196k (32%) from the opening price — seller is motivated, your offer sets the floor, not the list.
- At projected returns (-3.0% appreciation + 0.5% rent growth), your $116k cash investment doubles in ~6 years — after that, you're playing with house money.
- Climate carrying-cost: extreme-heat days projected 7→20/yr by 2055 (HVAC capex compounding) — expect insurance premiums to compound above CPI over the hold.
- Cap rate 13.2% vs local median 4.0% in Louisville/Jefferson County metro government (balance) — top-decile yield for the area; either an underpriced asset or a hidden risk that comps aren't pricing in. Stress-test before assuming the spread holds.
- At $6,527/mo this rent would consume 115% of the median local household income ($68k/yr) (locally 839% of renters already pay >50% of income on rent) — very limited rent-growth headroom before tenants either downsize or default.
Questions for listing agent
- It's been on market 35 days. Have you received any prior offers? Is the seller open to a 3% concession, seller financing, or rate buy-down credit?
- Can we see the unit-by-unit rent roll, current vacancy, and any below-market leases? What's the average tenancy length?
- What capital expenditures (roof, boiler, parking lot, exteriors) have been made in the last 5 years, and what's planned in the next 2?
- Built in 1975 — when were the roof, HVAC, electrical panel, plumbing, and water heater last replaced?
- Is there a deadline driving the sale (1031 exchange, divorce, estate, relocation)? That informs how much negotiation room exists.
- What's the average days-on-market for RENTAL listings here right now (not sales)? A rising rental-DOM trend means longer vacancies and softer asking-rent achievability than the comps imply.
- What's the recent tenant-quality profile in this submarket — average credit score on applications, eviction rate, late-payment / NSF rate, and stable-employment percentage? A property-management company in the area should have these aggregated.
- How much new apartment / multifamily construction is in the pipeline within 1–3 miles? Heavy new supply (>2% of stock underway) typically softens rents 12–24 months out; light construction supports rent growth.
CashFlowRE · CFR-JZWJM0D7PY4SYN
· Data 2 days ago
cashflowre.app · 2026-05-29