 6-Plex
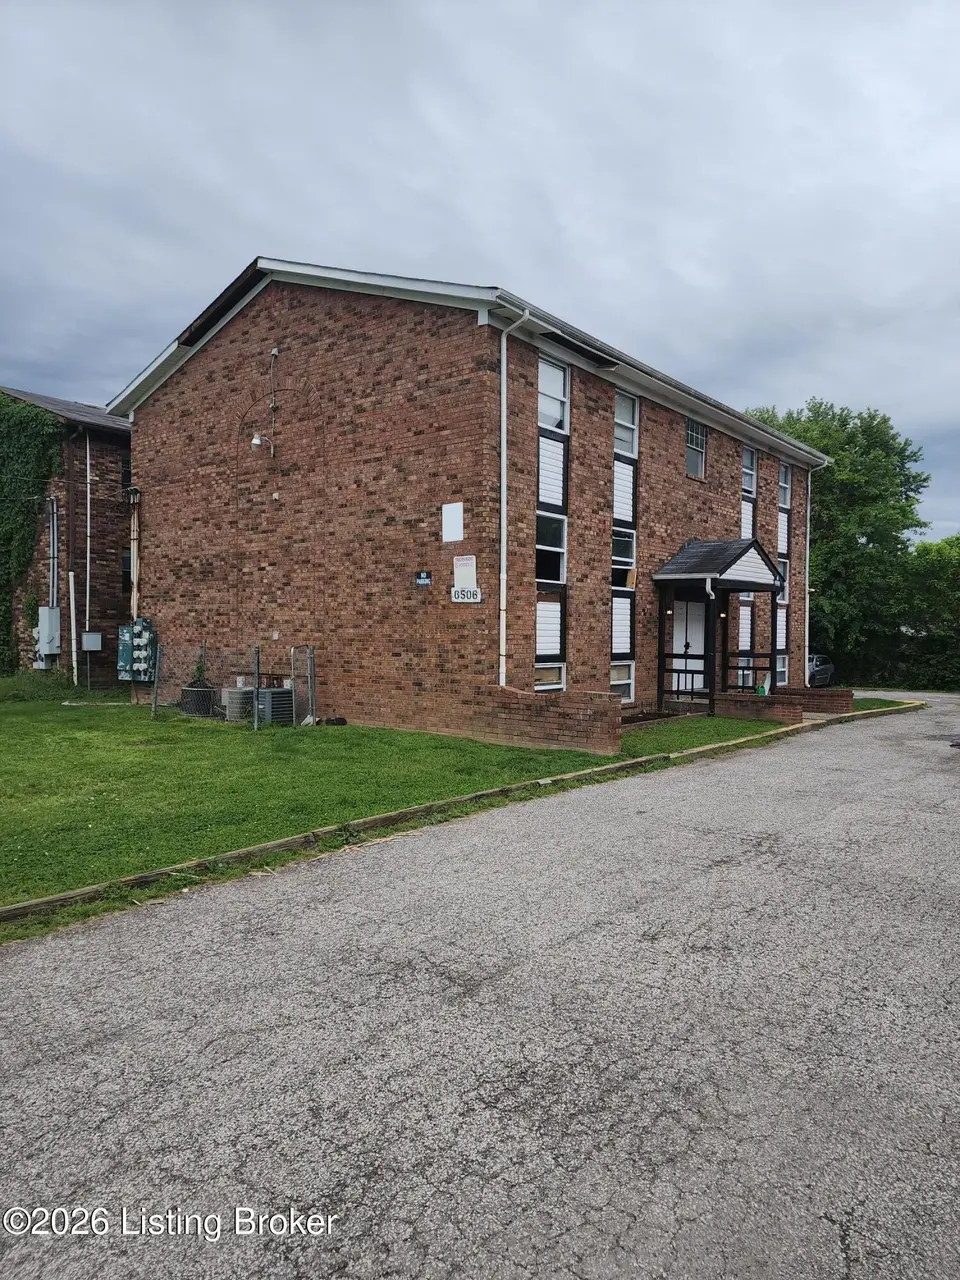
6506 Hackel Dr · Louisville/Jefferson County metro government (balance), KY
Flood risk 1/10 · Minimal
- FEMA flood zone
- X (shaded)
- Chance of flooding over 30 yrs
- 0.0%
- Est. flood insurance / yr
- $473 – $860
Fire risk 1/10 · Minimal
- Est. fire insurance / yr
- $839 – $1,559
Heat risk 5/10 · Moderate
- Hot days now (above 104°F)
- 7 days/yr
- Hot days in 30 yrs
- 20 days/yr
Wind risk 2/10 · Minimal
- Chance of severe wind over 30 yrs
- 2.0%
Air-quality risk 3/10 · Minor
- Unhealthy air days now
- 2 days/yr
- Unhealthy air days in 30 yrs
- 3 days/yr
Risk factors via First Street. Map © Google.
Why this score? — see what drove the B- grade
The composite is a weighted blend of 9 inputs, each scored 0–100. Each bar is that input's sub-score; the figure is the points it added to the 100-point composite (weight × sub-score).
- Cash flow +30.0/30.0
- 1% rule +10.0/10.0
- DSCR +10.0/10.0
- ARV discount +7.5/15.0
- Rent growth +2.6/5.0
- Livability +2.5/5.0
- Condition / age +2.5/5.0
- Schools +2.3/10.0
- Appreciation +0.0/10.0
$415,900
🖨 Deal sheet 📄 Offer letter ✓ Due diligence
Multi-family units
County records classify this as Multi-Family (5+ Unit). Listing-text estimate: 6 units. confirmed
5+ unit building — per-unit beds/baths from public records are typically unavailable; the breakdown below (if shown) is an estimate from the listing text.
Listing remarks MLS
INVESTMENT OPPORTUNITY: Over the last two years this building has been transformed and is now a stable performing asset and is positioned to bring the property to its full market rent potential. OFFERING HIGHLIGHTS INCLUDE: 4 of the 6 - 2 bed, 1 bath, 850 sqft units have been updated within the last two years. All leases are month to month. The roof, windows, 2 water heaters, 1 furnace and electrical panels in all 6 units have been replaced within the last 5 years. In the last two years 2 more new water heaters have been added. The remaining mechanicals have been repaired/serviced and are in good working condition. In 2021 a building with 2 6x10 storage units was added for additional income.
Key facts
- Open concept layouts
- Washer dryer hookups
- Storage units
Tags
Property features AI
Finance
- Other: Subdivision: HUNTERS HILL
- Financial info: Income/rent fields present for each level (rent values reported per level)
- HOA & community: No association fee
Exterior
- Parking: 10 parking spaces; No covered parking
- Utilities: Electricity connected; 6 furnaces; 6 HVAC units; Owner pays water and sewer; Owner pays trash removal; Tenants pay electric
- Home design: Apartment; Built in 1975
- Construction: Brick construction; Shingle roof; Living area reported as 3,430
- Exterior features: No exterior features listed; Lot features: See remarks
Interior
- Kitchen: Kitchens in each unit; Ranges in units; Refrigerators in units; Dishwashers in units
- Bedrooms: 12 total bedrooms (distributed across units)
- Bathrooms: Multiple full bathrooms across units (no partial bathrooms listed)
- Heating & cooling: Forced air heating; Central air conditioning
- Interior features: Apartment property type; Multiple units with separate meters; Additional storage available
- Laundry & utility: Laundry in each unit
Neighborhood map
What this means for you Summary
Snapshot
- This is a 6 × 2.0-bed/1.0-bath units multifamily listed at $416k.
Deal economics
- At list price, monthly cash flow is $2k ($29k/yr) — positive. Per door: $400/mo.
- The deal already cash-flows at list — no discount required.
- Meets the 1% rule at list price ($7k rent vs $416k).
- Recommended offer: $403k (3.0% below list) — sets the bar for market timing.
- Cap rate 13.2% vs local median 4.0% in Louisville/Jefferson County metro government (balance) — top-decile yield for the area; either an underpriced asset or a hidden risk that comps aren't pricing in. Stress-test before assuming the spread holds.
Location & tenants
- Location reads: area grade B — affects rentability + tenant quality, not the cash-flow math above.
- Jefferson County (urban): math 19% / reading 35% proficiency, ranked #121 of 165 in KY (top 73%) — low school quality limits family demand, transient renter base, plan for 1-2y turnover.
- Market conditions: Rents flat; 122 active listings in the ZIP; 2,836 units permitted in Jefferson County in 2024 (1,558 in 5+ unit buildings).
- At $6,527/mo this rent would consume 115% of the median local household income ($68k/yr) (locally 839% of renters already pay >50% of income on rent) — very limited rent-growth headroom before tenants either downsize or default.
Forward outlook
- Local home prices are declining (-3.0%/yr); year-one equity from $3k of loan paydown is wiped out by about $12k of value loss. Plan a longer hold.
- Jefferson County population projected at +13% by 2050 — modest demand growth; plan on rents tracking national, not racing it.
- At projected returns (-3.0% appreciation + 0.5% rent growth), your $116k cash investment doubles in ~6 years — after that, you're playing with house money.
Negotiation context
- It's been on market 35 days — a 3% lower offer ($403k) is reasonable based on typical stale-listing flexibility.
- 7 sale attempts since 25y ago; this cycle's ask has dropped $196k (32%) from the opening price — seller is motivated, your offer sets the floor, not the list.
Risks & watch-outs
- Climate carrying-cost: extreme-heat days projected 7→20/yr by 2055 (HVAC capex compounding) — expect insurance premiums to compound above CPI over the hold.
Questions for the listing agent
- It's been on market 35 days. Have you received any prior offers? Is the seller open to a 3% concession, seller financing, or rate buy-down credit?
- Can we see the unit-by-unit rent roll, current vacancy, and any below-market leases? What's the average tenancy length?
- What capital expenditures (roof, boiler, parking lot, exteriors) have been made in the last 5 years, and what's planned in the next 2?
- Built in 1975 — when were the roof, HVAC, electrical panel, plumbing, and water heater last replaced?
- Is there a deadline driving the sale (1031 exchange, divorce, estate, relocation)? That informs how much negotiation room exists.
- What's the average days-on-market for RENTAL listings here right now (not sales)? A rising rental-DOM trend means longer vacancies and softer asking-rent achievability than the comps imply.
- What's the recent tenant-quality profile in this submarket — average credit score on applications, eviction rate, late-payment / NSF rate, and stable-employment percentage? A property-management company in the area should have these aggregated.
- How much new apartment / multifamily construction is in the pipeline within 1–3 miles? Heavy new supply (>2% of stock underway) typically softens rents 12–24 months out; light construction supports rent growth.
Investment metrics
- 1% rule
- 1.57% ✓
- Cap rate
- 13.23%
- Cash-on-cash
- 24.76%
- DSCR
- 2.10
- GRM
- 5.3
CMA / ARV
No comps found within radius.
Projected returns pro-forma
-3.0% appreciation · 0.5% rent growth · sell at horizon
- IRR
- 15.4%
- Equity multiple
- 1.60×
- Total profit
- $69,639
- Equity at exit
- $62,012
- IRR
- 22.2%
- Equity multiple
- 2.68×
- Total profit
- $195,265
- Equity at exit
- $35,959
Cash invested: $116,452 (down + closing). Projections, not guarantees.
Landlord ↔ Tenant lean methodology
- Overall (STATE)
- 83 Strongly Landlord-Friendly
- State Kentucky
- 83 Strongly Landlord-Friendly · R+16
- County
- — inherits STATE
- City
- — inherits STATE
ZIP-level market 40258
- Rents YoY
- 0.5%
- Active inventory
- 122
- Price-to-rent
- 31.9×
Monthly cashflow live
- Estimated rent
- $6,527 medium interval (Pro) →
- Mortgage (P&I)
- −$2,181
- Tax from tax record
- −$399 /mo · $4,792/yr
- Insurance
- −$173
- HOA
- −$0
- Vacancy / Maint / Mgmt
- −$1,371
- Net cashflow
- $2,403
Break-even live
6-unit breakdown (identical units grouped — click to expand)
| Units | Beds | Baths | Est. rent |
|---|---|---|---|
| 6× units | 2.0 | 1 | $6,528 |
| #1 | 2.0 | 1 | $1,088 |
| #2 | 2.0 | 1 | $1,088 |
| #3 | 2.0 | 1 | $1,088 |
| #4 | 2.0 | 1 | $1,088 |
| #5 | 2.0 | 1 | $1,088 |
| #6 | 2.0 | 1 | $1,088 |
| Total (6 units) | $6,527 | ||
UW: 25.0% down · 7.5% · 30yr · 1.5% tax · 5.0% vac · 8.0% maint · 8.0% mgmt
Financing live
Cash to close
- Down payment
- $103,975
- Closing costs
- $12,477
- Reserves months
- —
- Total cash needed
- —
Loan-product check · same deal, 3 products live
Conventional
25% down · 7.5% · 30yr
- Down + closing
- —
- Monthly P&I
- —
- Monthly cashflow
- —
- DSCR
- —
- Eligible?
- —
Personal DTI + credit; lowest rate.
DSCR
20% down · 8.5% · 30yr
- Down + closing
- —
- Monthly P&I
- —
- Monthly cashflow
- —
- DSCR
- —
- Eligible?
- —
No personal income docs; deal must DSCR.
Hard money
10% down · 12.0% · 12mo
- Down + closing
- —
- Monthly P&I
- —
- Monthly cashflow
- —
- DSCR
- —
- Eligible?
- —
Short-term bridge; refi at stabilization.
Listing history 35 events
-
2026-06-18days on market $415,900 Active 35 DOM
-
2026-06-17price $415,900 Active 34 DOM
-
2026-06-17days on market $611,900 Active 34 DOM
-
2026-06-16days on market $611,900 Active 33 DOM
-
2026-06-15days on market $611,900 Active 32 DOM
-
2026-06-13days on market $611,900 Active 30 DOM
-
2026-06-10days on market $611,900 Active 27 DOM
-
2026-06-09days on market $611,900 Active 26 DOM
-
2026-06-08days on market $611,900 Active 25 DOM
-
2026-06-07days on market $611,900 Active 24 DOM
-
2026-06-03days on market $611,900 Active 20 DOM
-
2026-06-02days on market $611,900 Active 19 DOM
-
2026-06-01days on market $611,900 Active 18 DOM
-
2026-05-31days on market $611,900 Active 17 DOM
-
2026-05-14$611,900 Active
-
2022-12-01soldstatus $480,000
-
2022-11-22soldstatus $480,000 Closed 708-char remark
Show marketing remark (708 chars)
INVESTMENT OPPORTUNITY: Over the last two years this building has been transformed and is now a stable performing asset and is positioned to bring the property to its full market rent potential. OFFERING HIGHLIGHTS INCLUDE: 4 of the 6 - 2 bed, 1 bath, 850 sqft units have been updated within the last two years. All leases are month to month. The roof, windows, 2 water heaters, 1 furnace and electrical panels in all 6 units have been replaced within the last 5 years. In the last two years 2 more new water heaters have been added. The remaining mechanicals have been repaired/serviced and are in good working condition. In 2021 a building with 2 6x10 storage units was added for additional income.
-
2022-08-16status Pending 708-char remark
Show marketing remark (708 chars)
INVESTMENT OPPORTUNITY: Over the last two years this building has been transformed and is now a stable performing asset and is positioned to bring the property to its full market rent potential. OFFERING HIGHLIGHTS INCLUDE: 4 of the 6 - 2 bed, 1 bath, 850 sqft units have been updated within the last two years. All leases are month to month. The roof, windows, 2 water heaters, 1 furnace and electrical panels in all 6 units have been replaced within the last 5 years. In the last two years 2 more new water heaters have been added. The remaining mechanicals have been repaired/serviced and are in good working condition. In 2021 a building with 2 6x10 storage units was added for additional income.
-
2022-07-18$480,000 Active 708-char remark
Show marketing remark (708 chars)
INVESTMENT OPPORTUNITY: Over the last two years this building has been transformed and is now a stable performing asset and is positioned to bring the property to its full market rent potential. OFFERING HIGHLIGHTS INCLUDE: 4 of the 6 - 2 bed, 1 bath, 850 sqft units have been updated within the last two years. All leases are month to month. The roof, windows, 2 water heaters, 1 furnace and electrical panels in all 6 units have been replaced within the last 5 years. In the last two years 2 more new water heaters have been added. The remaining mechanicals have been repaired/serviced and are in good working condition. In 2021 a building with 2 6x10 storage units was added for additional income.
-
2020-11-09soldstatus $320,000
-
2019-02-01soldstatus $390,000
-
2015-01-27historical
-
2014-11-03$139,900
-
2014-03-31soldstatus $501,000
-
2008-11-13soldstatus $157,000
-
2007-09-27soldstatus $145,225
-
2004-03-16soldstatus $157,000
-
2004-03-09soldstatus $157,000
-
2003-12-15$161,000
-
2003-12-12historical
-
2003-10-29$169,000
-
2002-05-17soldstatus $159,900
-
2002-03-02$159,900
-
2002-02-10historical
-
2001-08-10$159,900
ⓘ Source: listings_history table (triggers on properties + properties_extension) + one-shot
backfill from property_details.listing_events for pre-trigger history.
Tax reassessment forecast KY · Resets to sale price
- Current annual tax
- $4,792 · $399/mo
- Projected year-2 tax
- $4,792 · $399/mo
- Expected delta
- $0/yr ($0/mo · 0.0%)
ⓘ Screening estimate from a state-policy table — verify with the county assessor before closing.
Climate risk First Street
- Flood 1/10 Low FEMA zone X (shaded) · 0% chance over 30 yrs
- Wildfire 1/10 Low
- Heat 5/10 Major 7 d/yr ≥104°F today · 20 d/yr by 30 yrs out
- Wind 2/10 Low 2% chance of damaging wind over 30 yrs
- Air quality 3/10 Moderate 2 unhealthy d/yr today · 3 by 30 yrs out
Nearby sold comps map
Loading sold comps map…
Walkable amenities ~0.75 mi
Loading nearby amenities…
Taxation est. · year 1
- Rental income
- $78,324
- − Mortgage interest
- −$23,297
- − Property taxes
- −$4,792
- − Insurance
- −$2,080
- − Repairs & maintenance
- −$6,266
- − Management
- −$6,266
- − Depreciation
- −$12,099
- Taxable income
- $23,525
- Est. tax owed @ 24.0%
- −$5,646
- After-tax cash flow
- $23,186/yr
For passive investors: Depreciation is non-cash, so a rental often shows a tax loss while cash-flowing — sheltering income. Rental losses are passive: they offset passive income freely, and up to $25,000/yr can offset ordinary (W-2) income if you actively participate and your MAGI is under $100k (phasing out to $0 by $150k); unused losses carry forward. On sale, claimed depreciation is recaptured at up to 25%, and gains may owe capital-gains tax (a 1031 exchange can defer both). Figures are a year-1 estimate at your 24.0% rate — not tax advice; consult a CPA.
Schools (NCES district)
- District
- Jefferson County
- NCES district ID
- 2102990
- Math proficiency
- 19% ▼ -17.00%
- Reading proficiency
- 35% ▼ -11.00%
- Median HH income
- $47,885
- Composite
- 23.45/100
- National rank
- #7884
- State rank
- #121 of 165 in KY
Livability — Louisville/Jefferson County metro government (balance)
No livability data for this city. (Only ~50 U.S. cities are tracked.)
Census & demographics
- Census place
- Louisville/Jefferson County metro government (balance), KY
- County
- Jefferson County · 790,184 people
- City population
- 419,741
- Metro
- Louisville/Jefferson County, KY-IN
- Population (ZIP)
- 26,841
- Household income
- $68,162
- Rent vs Own
- Severe rent burden
- 839.0
Population outlook (Jefferson County) Hauer SSP2
- Today (2025)
- 823,112 people
- By 2030
- 849,343 · +3.2%
- By 2040
- 895,696 · +8.8%
- By 2050
- 933,630 · +13.4%
- By 2075
- 1,028,262 · +24.9%
- By 2100
- 1,072,675 · +30.3%
Race, ethnicity, and origin ACS 2023
- Neighborhood character
- Predominantly White (67%)
- Race & ethnicity
- White 67% Black 22% Two or more races 8% Hispanic / Latino 5%
- Hispanic origin (detail)
- Mexican 3% Cuban 1%
- Common ancestry
- Iranian 2% Italian 2% Slovak 2%
- Foreign-born
- 5% · Canada
- Languages at home
- 94% English-only · Spanish 4%
Political lean MEDSL · Jefferson
- 2024 margin
- D (+16.6) · D 57.4% · R 40.9% · Other 1.7%
- 2008→2024 swing
- +4.5pp toward D · 2008: 12.0pp · 2024: 16.6pp
- All cycles
- 2024: D+16.6 2020: D+20.1 2016: D+13.3 2012: D+11.1 2008: D+12.0
Not yet ingested
- Civics
- —
Market trends
- HPI YoY
- ▼ -296.36%
- Current HPI
- 244.6667
- Rent YoY
- ▲ 0.50%
- Metro
- Louisville/Jefferson County, KY-IN
- State GDP YoY
- ▲ 1.81%
- F500 in state
- 4
Industry mix (Fortune 500 HQ in KY)
| Industry | F500 HQs | Revenue |
|---|---|---|
| Healthcare | 1 | $118B |
|
||
| Food / Beverage | 1 | $7B |
|
||
Price history
+282.7% since first listed21 events — show timeline
- 2026-05-14 Listed $611,900 Metro Search MLS
- 2022-12-01 Sold (Public Records) $480,000 Public Records
- 2022-11-22 Sold (MLS) $480,000 Metro Search MLS
- 2022-08-16 Pending — Metro Search MLS
- 2022-07-18 Listed $480,000 Metro Search MLS
- 2020-11-09 Sold (Public Records) $320,000 Public Records
- 2019-02-01 Sold (Public Records) $390,000 Public Records
- 2015-01-27 Listing Removed — Metro Search MLS
- 2014-11-03 Listed $139,900 Metro Search MLS
- 2014-03-31 Sold (Public Records) $501,000 Public Records
- 2008-11-13 Sold (Public Records) $157,000 Public Records
- 2007-09-27 Sold (Public Records) $145,225 Public Records
- 2004-03-16 Sold (Public Records) $157,000 Public Records
- 2004-03-09 Sold (MLS) $157,000 Metro Search MLS
- 2003-12-15 Listed $161,000 Metro Search MLS
- 2003-12-12 Listing Removed — Metro Search MLS
- 2003-10-29 Listed $169,000 Metro Search MLS
- 2002-05-17 Sold (MLS) $159,900 Metro Search MLS
- 2002-03-02 Listed $159,900 Metro Search MLS
- 2002-02-10 Listing Removed — Metro Search MLS
- 2001-08-10 Listed $159,900 Metro Search MLS
Property tax history
+16.7%/yrLatest (2025): $4,792 · -2.1% YoY. Source: county tax records.
Cash-flow waterfall
monthlySold comps — $/sqft
last 12 mo · ≤1 miLoading sold comps…