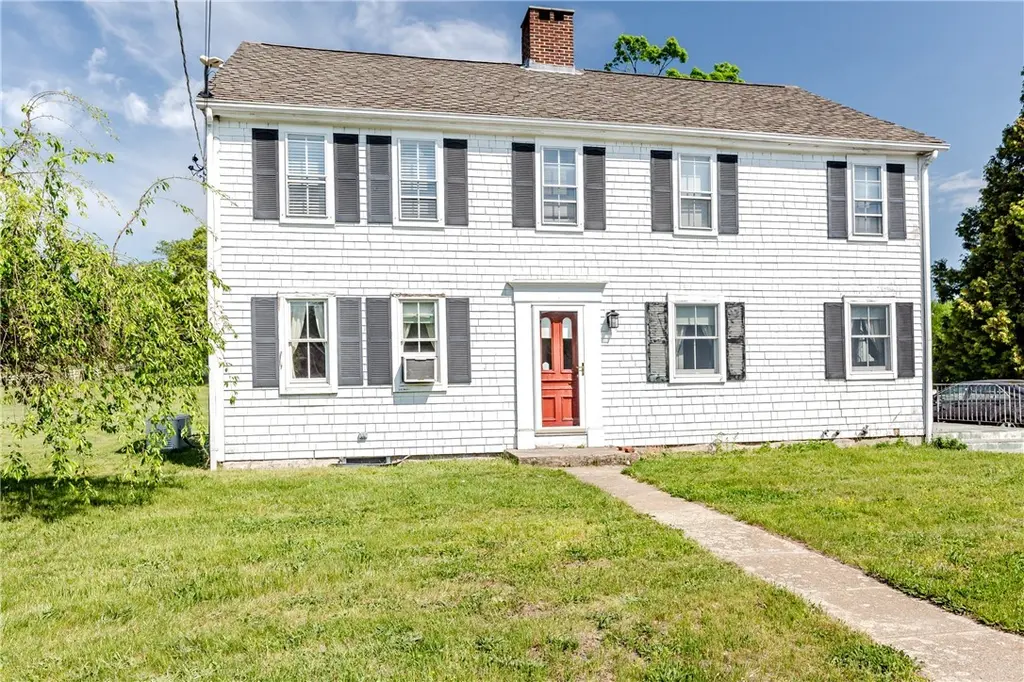
60 Colwell Rd
Greenville, RI 02828
$499,900B-
3 bd · 2.0 ba ·
2,497 sqft ·
Built 1830
· MultiFamily
· Active
· 9 DOM
Cashflow @ list (25.0% down · 7.5%)
Estimated rent
$6,200/mo
Mortgage (P&I)
−$2,622
Tax + insurance
−$714
HOA
−$0
Vac / Maint / Mgmt
−$1,302
Net cashflow
$1,562/mo
Annual
$18,749/yr
Cap rate
10.04%
Cash-on-cash
13.39%
DSCR
1.60
1% rule
1.24%
Cash to close
$139,972
Investor read
- This is a 2 × 2-bed/1.0-bath units multifamily listed at $500k.
- At list price, monthly cash flow is $2k ($19k/yr) — positive. Per door: $781/mo.
- The deal already cash-flows at list — no discount required.
- Meets the 1% rule at list price ($6k rent vs $500k).
- Only 9 days on market — expect competitive offers; lowballing is unlikely to land.
- Local home prices are declining (-3.0%/yr); year-one equity from $3k of loan paydown is wiped out by about $15k of value loss. Plan a longer hold.
- Location reads 72/100 on livability (#13 in RI) — a middle-class / working-renter tenant base. Strengths: crime A+, employment A+, housing A+; Watch: cost of living D, amenities F, commute F.
- Smithfield (suburban): math 37% / reading 55% proficiency, ranked #10 of 39 in RI (top 26%) — families likely to look elsewhere, expect single-tenant / working-renter base with shorter leases; only 11% free/reduced lunch — higher-income household profile.
- Zoned schools: Vincent J. Gallagher Middle (math 30% / reading 44%, grade F, #12 of 57 statewide, top 21%, 537 students, 15% FRL); Smithfield High School (math 42% / reading 67%, grade C-, #8 of 58 statewide, top 12%, 772 students, 11% FRL) — zoned schools at 13% FRL track the district average.
- Watch-outs: built in 1830 — expect roof / HVAC / electrical / plumbing capex.
- Market conditions: 23 active listings in the ZIP; 1 comparable units currently listed for rent nearby; 776 units permitted in Providence County in 2024 (229 in 5+ unit buildings).
- Providence County population projected at +5% by 2050 — modest demand growth; plan on rents tracking national, not racing it.
- At projected returns (-3.0% appreciation + 3.0% rent growth), your $140k cash investment doubles in ~9 years — after that, you're playing with house money.
- Cap rate 10.0% vs local median 1.3% in Greenville — top-decile yield for the area; either an underpriced asset or a hidden risk that comps aren't pricing in. Stress-test before assuming the spread holds.
Questions for listing agent
- Can we see the unit-by-unit rent roll, current vacancy, and any below-market leases? What's the average tenancy length?
- What capital expenditures (roof, boiler, parking lot, exteriors) have been made in the last 5 years, and what's planned in the next 2?
- Built in 1830 — when were the roof, HVAC, electrical panel, plumbing, and water heater last replaced?
- Is there a deadline driving the sale (1031 exchange, divorce, estate, relocation)? That informs how much negotiation room exists.
- Schools are B-rated — typically a magnet for longer-tenancy family renters. What's the average tenant stay here, and is there a school-zone premium baked into asking?
- What's the average days-on-market for RENTAL listings here right now (not sales)? A rising rental-DOM trend means longer vacancies and softer asking-rent achievability than the comps imply.
- What's the recent tenant-quality profile in this submarket — average credit score on applications, eviction rate, late-payment / NSF rate, and stable-employment percentage? A property-management company in the area should have these aggregated.
- How much new apartment / multifamily construction is in the pipeline within 1–3 miles? Heavy new supply (>2% of stock underway) typically softens rents 12–24 months out; light construction supports rent growth.
CashFlowRE · CFR-K01RACF1XXGNP6
· Data 6 h ago
cashflowre.app · 2026-05-29