 Duplex
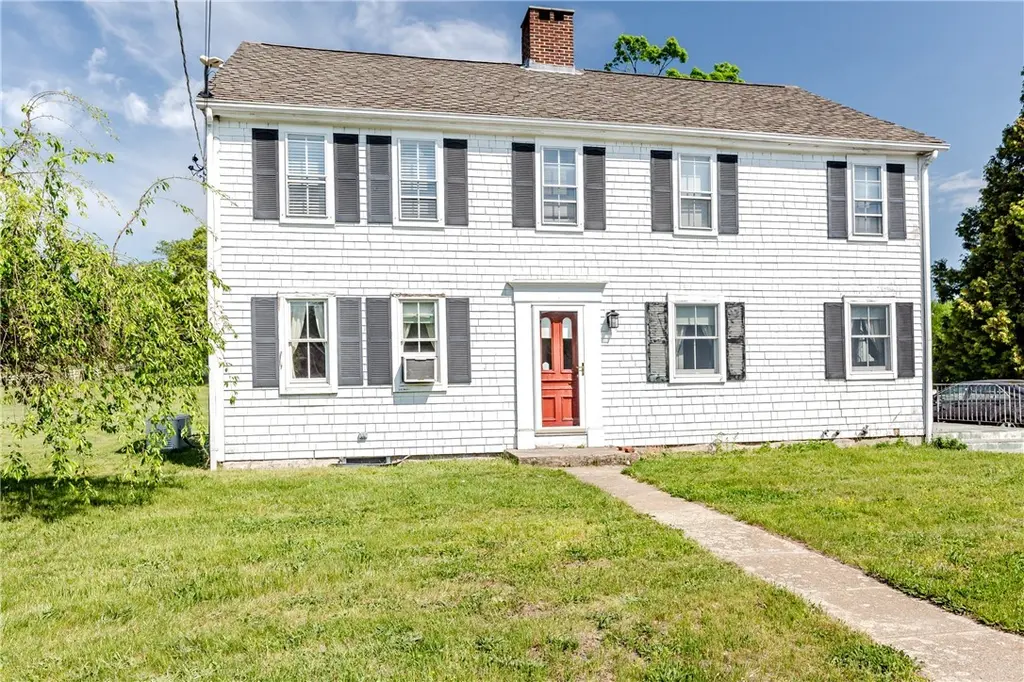
60 Colwell Rd · Smithfield, RI
Flood risk No data
- FEMA flood zone
- —
- Chance of flooding over 30 yrs
- —
- Est. flood insurance / yr
- —
Fire risk No data
- Est. fire insurance / yr
- —
Heat risk No data
- Hot days now (above threshold)
- —
- Hot days in 30 yrs
- —
Wind risk No data
- Chance of severe wind over 30 yrs
- —
Air-quality risk No data
- Unhealthy air days now
- —
- Unhealthy air days in 30 yrs
- —
Risk factors via First Street. Map © Google.
Why this score? — see what drove the C+ grade
The composite is a weighted blend of 9 inputs, each scored 0–100. Each bar is that input's sub-score; the figure is the points it added to the 100-point composite (weight × sub-score).
- Cash flow +28.0/30.0
- DSCR +10.0/10.0
- ARV discount +7.5/15.0
- 1% rule +7.4/10.0
- Schools +4.2/10.0
- Rent growth +2.5/5.0
- Livability +2.5/5.0
- Condition / age +2.5/5.0
- Appreciation +0.0/10.0
$499,900
🖨 Deal sheet (PDF) 📄 Offer letter ✓ Due diligence
Multi-family units
County records classify this as Multi-Family (2-4 Unit). Listing-text estimate: 2 units. confirmed
Listing remarks
Opportunity to own one of Smithfield's historic two-family homes, beautifully situated on a 1.84-acre corner lot. Built in 1830, this property offers timeless charm and character, featuring multiple fireplaces, wide pine plank flooring and thoughtful modern updates throughout. The first-floor unit boasts over 1,300 square feet of living space, including 3 bedrooms, 2 fireplaces, a spacious living room, a large eat-in kitchen, an updated full bath and a convenient laundry area. The second-floor unit features over 1,100 square feet, an updated eat-in kitchen, 2 bedrooms, a cozy sitting room and a generous sized living room. Additional highlights include a full walk-up attic and full basement
Key facts
- 1.84 acre lot
- 4 parking spots
- Community pool
Property features AI
Finance
- Financial info: Operating expenses listed: $6,069 (multi-family operating expense)
- HOA & community: Community amenities nearby: golf, pool, tennis courts, recreation area, public transportation, restaurants, shopping, highway access, schools
Exterior
- Parking: No garage; Space for 4 vehicles (total)
- Utilities: Private well water; Cesspool sewer; Electric service with 100 amps, circuit breakers and separate meters
- Home design: Two-story building; Fixer condition
- Construction: Plaster interior walls; Shingle siding; Wood siding; Stone foundation; Built as multi-unit (2 units in 1 building)
- Exterior features: Corner lot; Outbuilding
Interior
- Kitchen: Oven; Range; Dishwasher; Refrigerator
- Bedrooms: Two-bedroom unit; Three-bedroom unit
- Flooring: Hardwood; Wood; Ceramic tile; Carpet
- Bathrooms: Two full bathrooms (total); Each unit has one full bathroom
- Heating & cooling: Oil-fired heating with baseboard radiation; Window cooling units
- Interior features: Attic with permanent attic stairs; Storage room; Interior steps; Bathtub; Tub/shower; Storm windows; Storm doors; Unfinished full basement with interior and exterior entry
- Laundry & utility: Washer and dryer included; Common-area laundry
Neighborhood map
What this means for you Summary
Snapshot
- This is a 2 × 2-bed/1.0-bath units multifamily listed at $500k.
Deal economics
- At list price, monthly cash flow is $2k ($19k/yr) — positive. Per door: $781/mo.
- The deal already cash-flows at list — no discount required.
- Meets the 1% rule at list price ($6k rent vs $500k).
Location & tenants
- Location reads: area grade C — affects rentability + tenant quality, not the cash-flow math above.
- Smithfield (suburban): math 37% / reading 55% proficiency, ranked #10 of 39 in RI (top 26%) — families likely to look elsewhere, expect single-tenant / working-renter base with shorter leases; only 11% free/reduced lunch — higher-income household profile.
- Market conditions: 23 active listings in the ZIP; 1 comparable units currently listed for rent nearby; 776 units permitted in Providence County in 2024 (229 in 5+ unit buildings).
Forward outlook
- Local home prices are declining (-3.0%/yr); year-one equity from $3k of loan paydown is wiped out by about $15k of value loss. Plan a longer hold.
- Providence County population projected at +5% by 2050 — modest demand growth; plan on rents tracking national, not racing it.
- At projected returns (-3.0% appreciation + 3.0% rent growth), your $140k cash investment doubles in ~9 years — after that, you're playing with house money.
Negotiation context
- Only 9 days on market — expect competitive offers; lowballing is unlikely to land.
Risks & watch-outs
- Watch-outs: built in 1830 — expect roof / HVAC / electrical / plumbing capex.
Questions for the listing agent
- Can we see the unit-by-unit rent roll, current vacancy, and any below-market leases? What's the average tenancy length?
- What capital expenditures (roof, boiler, parking lot, exteriors) have been made in the last 5 years, and what's planned in the next 2?
- Built in 1830 — when were the roof, HVAC, electrical panel, plumbing, and water heater last replaced?
- Is there a deadline driving the sale (1031 exchange, divorce, estate, relocation)? That informs how much negotiation room exists.
- What's the average days-on-market for RENTAL listings here right now (not sales)? A rising rental-DOM trend means longer vacancies and softer asking-rent achievability than the comps imply.
- What's the recent tenant-quality profile in this submarket — average credit score on applications, eviction rate, late-payment / NSF rate, and stable-employment percentage? A property-management company in the area should have these aggregated.
- How much new apartment / multifamily construction is in the pipeline within 1–3 miles? Heavy new supply (>2% of stock underway) typically softens rents 12–24 months out; light construction supports rent growth.
Investment metrics
- 1% rule
- 1.24% ✓
- Cap rate
- 10.04%
- Cash-on-cash
- 13.39%
- DSCR
- 1.60
- GRM
- 6.7
CMA / ARV
No comps found within radius.
Projected returns pro-forma
-3.0% appreciation · 3.0% rent growth · sell at horizon
- IRR
- 3.4%
- Equity multiple
- 1.13×
- Total profit
- $18,527
- Equity at exit
- $74,537
- IRR
- 13.0%
- Equity multiple
- 2.03×
- Total profit
- $144,353
- Equity at exit
- $43,222
Cash invested: $139,972 (down + closing). Projections, not guarantees.
Landlord ↔ Tenant lean methodology
- Overall (STATE)
- 31 Tenant-Leaning
- State Rhode Island
- 31 Tenant-Leaning · D+8
- County
- — inherits STATE
- City
- — inherits STATE
ZIP-level market 02828
- Active inventory
- 23
- Price-to-rent
- 13.4×
Monthly cashflow live
- Estimated rent
- $6,200 medium interval (Pro) →
- Mortgage (P&I)
- −$2,622
- Tax from tax record
- −$506 /mo · $6,069/yr
- Insurance
- −$208
- HOA
- −$0
- Vacancy / Maint / Mgmt
- −$1,302
- Net cashflow
- $1,562
Break-even live
Sensitivity live
| Price | -10% $1,845 | -5% $1,704 | +0% $1,562 | +5% $1,421 | +10% $1,279 |
|---|---|---|---|---|---|
| Rent | -10% $1,073 | -5% $1,318 | +0% $1,562 | +5% $1,807 | +10% $2,052 |
| Rate | -1.0pp $1,814 | -0.5pp $1,690 | base $1,562 | +0.5pp $1,433 | +1.0pp $1,301 |
2-unit breakdown (identical units grouped — click to expand)
| Units | Beds | Baths | Est. rent |
|---|---|---|---|
| 2× units | 2 | 1 | $6,200 |
| #1 | 2 | 1 | $3,100 |
| #2 | 2 | 1 | $3,100 |
| Total (2 units) | $6,200 | ||
UW: 25.0% down · 7.5% · 30yr · 1.5% tax · 5.0% vac · 8.0% maint · 8.0% mgmt
Financing live
Cash to close
- Down payment
- $124,975
- Closing costs
- $14,997
- Reserves months
- —
- Total cash needed
- —
Loan-product check · same deal, 3 products live
Conventional
25% down · 7.5% · 30yr
- Down + closing
- —
- Monthly P&I
- —
- Monthly cashflow
- —
- DSCR
- —
- Eligible?
- —
Personal DTI + credit; lowest rate.
DSCR
20% down · 8.5% · 30yr
- Down + closing
- —
- Monthly P&I
- —
- Monthly cashflow
- —
- DSCR
- —
- Eligible?
- —
No personal income docs; deal must DSCR.
Hard money
10% down · 12.0% · 12mo
- Down + closing
- —
- Monthly P&I
- —
- Monthly cashflow
- —
- DSCR
- —
- Eligible?
- —
Short-term bridge; refi at stabilization.
Rent comps 1 comps
| Address | Beds | Baths | Sqft | Rent | $/sqft | DOM | Units | Dist |
|---|---|---|---|---|---|---|---|---|
| 3 Wentworth Ave Chepachet, RI | 2.0 | 2.5 | 3040 | $3,500 | $1.15 | 11d | 1 | 1.19mi |
Listing history 7 events
-
2026-06-21days on market $499,900 Active 9 DOM
-
2026-06-18days on market $499,900 Active 6 DOM
-
2026-06-17days on market $499,900 Active 5 DOM
-
2026-06-16days on market $499,900 Active 4 DOM
-
2026-06-15days on market $499,900 Active 3 DOM
-
2026-06-13remarks 699-char remark
-
2026-06-13$499,900 Active 1 DOM
ⓘ Source: listings_history table (triggers on properties + properties_extension) + one-shot
backfill from property_details.listing_events for pre-trigger history.
Tax reassessment forecast RI · Partial reset (capped growth)
- Current annual tax
- $6,069 · $506/mo
- Projected year-2 tax
- $7,109 · $592/mo
- Expected delta
- +$1,040/yr (+$87/mo · 17.1%)
ⓘ Screening estimate from a state-policy table — verify with the county assessor before closing.
Nearby sold comps map
Loading sold comps map…
Walkable amenities ~0.75 mi
Loading nearby amenities…
Taxation est. · year 1
- Rental income
- $74,400
- − Mortgage interest
- −$28,002
- − Property taxes
- −$6,069
- − Insurance
- −$2,500
- − Repairs & maintenance
- −$5,952
- − Management
- −$5,952
- − Depreciation
- −$14,543
- Taxable income
- $11,383
- Est. tax owed @ 24.0%
- −$2,732
- After-tax cash flow
- $16,017/yr
For passive investors: Depreciation is non-cash, so a rental often shows a tax loss while cash-flowing — sheltering income. Rental losses are passive: they offset passive income freely, and up to $25,000/yr can offset ordinary (W-2) income if you actively participate and your MAGI is under $100k (phasing out to $0 by $150k); unused losses carry forward. On sale, claimed depreciation is recaptured at up to 25%, and gains may owe capital-gains tax (a 1031 exchange can defer both). Figures are a year-1 estimate at your 24.0% rate — not tax advice; consult a CPA.
Schools (NCES district)
- District
- Smithfield
- NCES district ID
- 4400990
- Math proficiency
- 37% ▼ -5.00%
- Reading proficiency
- 55% ▼ -3.00%
- Median HH income
- $73,180
- Composite
- 41.62/100
- National rank
- #3433
- State rank
- #10 of 39 in RI
Livability — Smithfield
No livability data for this city. (Only ~50 U.S. cities are tracked.)
Census & demographics
- Population (ZIP)
- 7,058
Population outlook (Providence County) Hauer SSP2
- Today (2025)
- 653,469 people
- By 2030
- 660,819 · +1.1%
- By 2040
- 672,747 · +3.0%
- By 2050
- 683,741 · +4.6%
- By 2075
- 720,435 · +10.2%
- By 2100
- 741,582 · +13.5%
Race, ethnicity, and origin ACS 2023
- Neighborhood character
- Predominantly White (90%)
- Race & ethnicity
- White 90% Two or more races 6% Hispanic / Latino 5% Black 2%
- Hispanic origin (detail)
- Puerto Rican 3% Dominican 2%
- Common ancestry
- Lithuanian 15% Russian 7% Romanian 3%
- Foreign-born
- 3% · Canada
- Languages at home
- 93% English-only · Spanish 3% French/Haitian/Cajun 2% Other Indo-European 1%
Political lean MEDSL · Providence
- 2024 margin
- D (+14.4) · D 56.1% · R 41.7% · Other 2.2%
- 2008→2024 swing
- -20.0pp toward R · 2008: 34.4pp · 2024: 14.4pp
- All cycles
- 2024: D+14.4 2020: D+22.9 2016: D+21.2 2012: D+34.9 2008: D+34.4
Not yet ingested
- Civics
- —
Market trends
- HPI YoY
- ▼ -395.83%
- Current HPI
- 336.5889
- Rent YoY
- —
- Metro
- —
- State GDP YoY
- ▲ 2.25%
- F500 in state
- 10
Industry mix (Fortune 500 HQ in RI)
| Industry | F500 HQs | Revenue |
|---|---|---|
| Healthcare | 1 | $373B |
|
||
| Food Distribution | 1 | $31B |
|
||
| Aerospace / Defense | 1 | $14B |
|
||
| Financial Services | 1 | $8B |
|
||
| Consumer Goods | 1 | $4B |
|
||
Price history
1 event — show timeline
- 2026-06-13 Listed $499,900 RIS
Property tax history
+2.5%/yrLatest (2025): $6,069 · +21.3% YoY. Source: county tax records.
Cash-flow waterfall
monthlySold comps — $/sqft
last 12 mo · ≤1 miLoading sold comps…