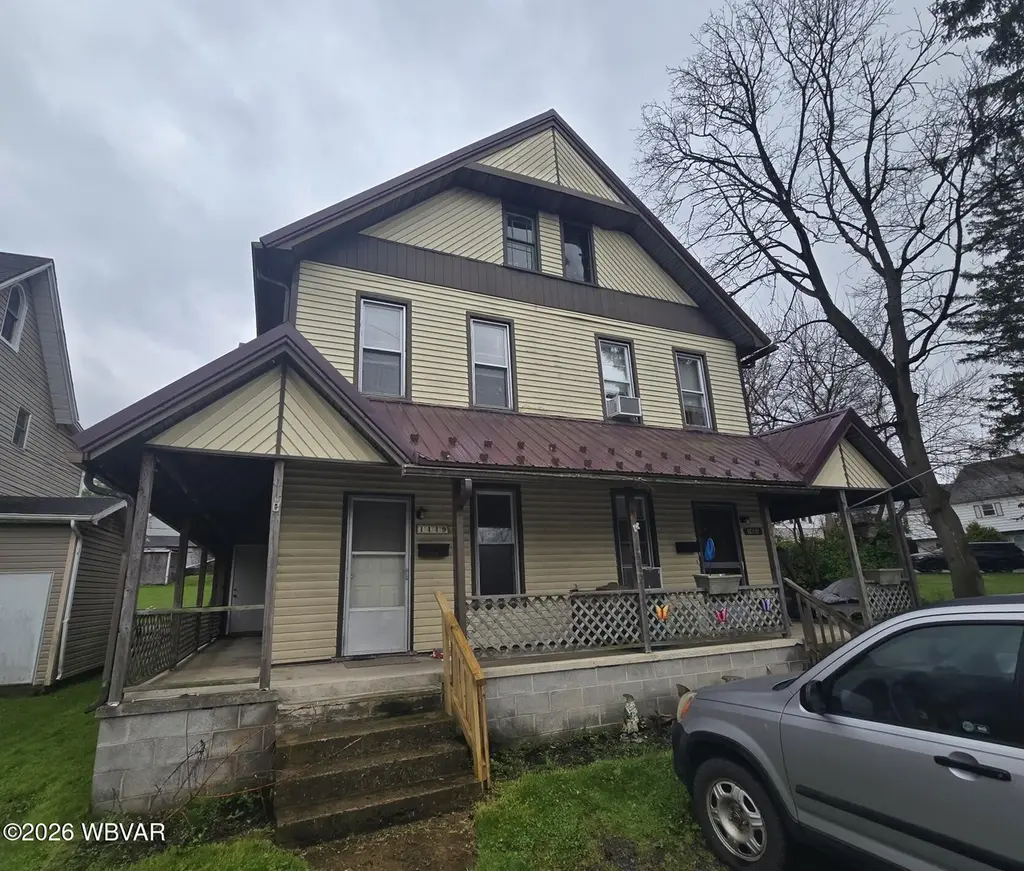
1449 Allegheny St
Jersey Shore, PA 17740
$189,900B
3 bd · 2.5 ba ·
3,509 sqft ·
Built 1901
· MultiFamily
· Active
· 28 DOM
Cashflow @ list (25.0% down · 7.5%)
Estimated rent
$2,895/mo
Mortgage (P&I)
−$996
Tax + insurance
−$358
HOA
−$0
Vac / Maint / Mgmt
−$608
Net cashflow
$933/mo
Annual
$11,198/yr
Cap rate
12.19%
Cash-on-cash
21.06%
DSCR
1.94
1% rule
1.52%
Cash to close
$53,172
Investor read
- This is a 2 × 3-bed/1-bath units multifamily listed at $190k.
- At list price, monthly cash flow is $933 ($11k/yr) — positive. Per door: $467/mo.
- The deal already cash-flows at list — no discount required.
- Meets the 1% rule at list price ($3k rent vs $190k).
- It's been on market 28 days — a 2% lower offer ($187k) is reasonable based on typical stale-listing flexibility.
- Recommended offer: $187k (1.5% below list) — sets the bar for market timing.
- Local home prices are declining (-3.0%/yr); year-one equity from $1k of loan paydown is wiped out by about $6k of value loss. Plan a longer hold.
- Location reads 74/100 on livability (#490 in PA, #4,504 nationally) — a middle-class / working-renter tenant base. Strengths: cost of living A+, housing A+, health & safety A+; Watch: amenities F, commute F, employment D-.
- Jersey Shore Area SD (town): math 41% / reading 59% proficiency, ranked #179 of 539 in PA (top 33%) — acceptable for families but not a draw, mixed tenant base, ~2y average lease.
- Watch-outs: built in 1901 — expect roof / HVAC / electrical / plumbing capex.
- Market conditions: 46 active listings in the ZIP; 73 units permitted in Lycoming County in 2024 (15 in 5+ unit buildings).
- Lycoming County population projected to shrink 10% by 2050 — rents likely to lag national; underwrite the cash flow, not the appreciation.
- At projected returns (-3.0% appreciation + 3.0% rent growth), your $53k cash investment doubles in ~6 years — after that, you're playing with house money.
- Cap rate 12.2% vs local median 3.0% in Jersey Shore — top-decile yield for the area; either an underpriced asset or a hidden risk that comps aren't pricing in. Stress-test before assuming the spread holds.
Questions for listing agent
- Can we see the unit-by-unit rent roll, current vacancy, and any below-market leases? What's the average tenancy length?
- What capital expenditures (roof, boiler, parking lot, exteriors) have been made in the last 5 years, and what's planned in the next 2?
- Built in 1901 — when were the roof, HVAC, electrical panel, plumbing, and water heater last replaced?
- Is there a deadline driving the sale (1031 exchange, divorce, estate, relocation)? That informs how much negotiation room exists.
- Schools are B-rated — typically a magnet for longer-tenancy family renters. What's the average tenant stay here, and is there a school-zone premium baked into asking?
- What's the average days-on-market for RENTAL listings here right now (not sales)? A rising rental-DOM trend means longer vacancies and softer asking-rent achievability than the comps imply.
- What's the recent tenant-quality profile in this submarket — average credit score on applications, eviction rate, late-payment / NSF rate, and stable-employment percentage? A property-management company in the area should have these aggregated.
- How much new apartment / multifamily construction is in the pipeline within 1–3 miles? Heavy new supply (>2% of stock underway) typically softens rents 12–24 months out; light construction supports rent growth.
CashFlowRE · CFR-K04YYP258MQ55C
· Data 1 day ago
cashflowre.app · 2026-05-29