 Duplex
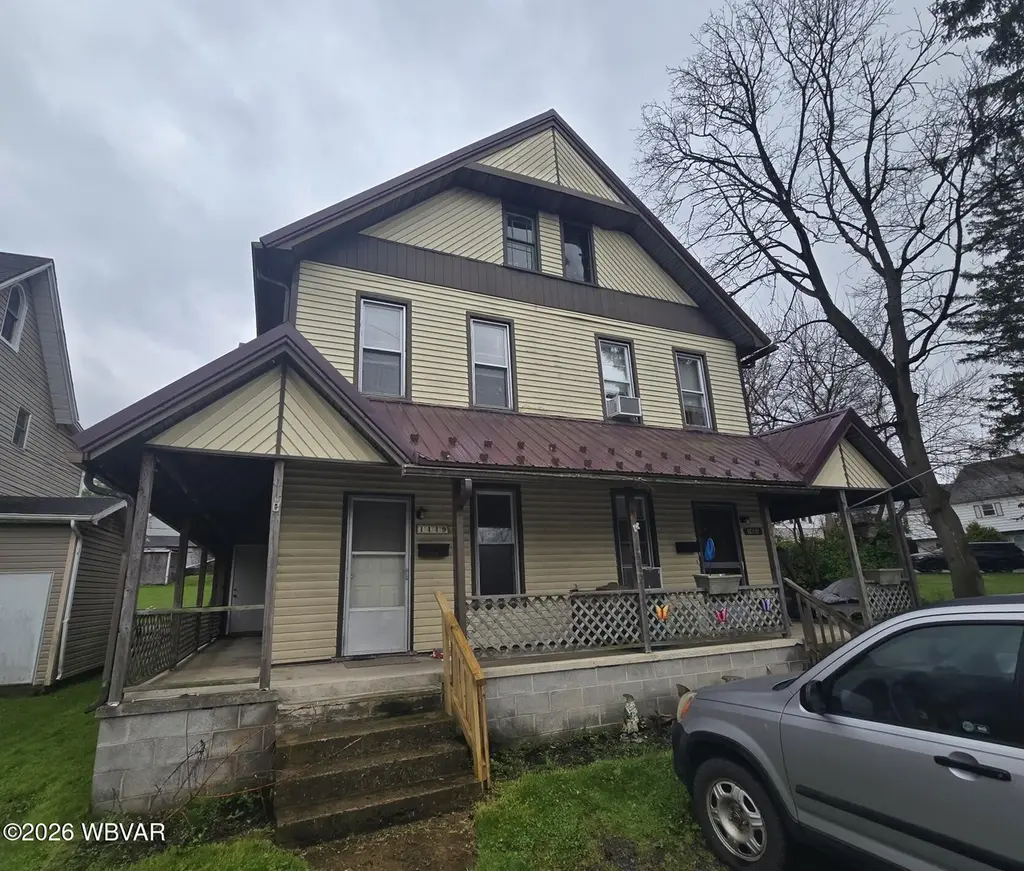
1449 Allegheny St · Jersey Shore, PA
Flood risk 1/10 · Minimal
- FEMA flood zone
- X (unshaded)
- Chance of flooding over 30 yrs
- 0.0%
- Est. flood insurance / yr
- $473 – $860
Fire risk 3/10 · Minor
- Est. fire insurance / yr
- $511 – $949
Heat risk 4/10 · Minor
- Hot days now (above 98°F)
- 7 days/yr
- Hot days in 30 yrs
- 16 days/yr
Wind risk 2/10 · Minimal
- Chance of severe wind over 30 yrs
- —
Air-quality risk 1/10 · Minimal
- Unhealthy air days now
- 0 days/yr
- Unhealthy air days in 30 yrs
- 0 days/yr
Risk factors via First Street. Map © Google.
Why this score? — see what drove the B grade
The composite is a weighted blend of 9 inputs, each scored 0–100. Each bar is that input's sub-score; the figure is the points it added to the 100-point composite (weight × sub-score).
- Cash flow +30.0/30.0
- 1% rule +10.0/10.0
- DSCR +10.0/10.0
- ARV discount +7.5/15.0
- Schools +4.3/10.0
- Livability +3.7/5.0
- Rent growth +2.5/5.0
- Condition / age +2.5/5.0
- Appreciation +0.0/10.0
$189,900
🖨 Deal sheet 📄 Offer letter ✓ Due diligence
Multi-family units
County records classify this as Multi-Family (2-4 Unit). Listing-text estimate: 2 units. confirmed
Listing remarks
Jersey Shore, PA double (2 unit) for sale, 3 BR each side, utilities separated, one unit vacant and one occupied. live in one and rent out the other! or rent both out. large yard, close to Weis markets, off street parking, video tour available. .. just ask. please allow 48 hours notice for showings for the occupied side. Thank you. Fair rent is $1100-1200 with tenants paying their own utilities.
Key facts
- Off street parking
- Large yard
- Utilities separated
Tags
Property features AI
Exterior
- Parking: Gravel parking; 4 open parking spaces
- Utilities: Public water; Electric with circuit breakers
- Home design: Residential income property; Multi-family (multi-units)
- Construction: Frame construction with vinyl siding; Stone foundation; Built as multi-unit residential income property
- Exterior features: Metal roof; Property has a view; Zoned R
Interior
- Flooring: Laminate
- Heating & cooling: Natural gas heating; Oil heating; Hot water heating; No cooling
- Interior features: Laminate flooring; Has heating
Neighborhood map
What this means for you Summary
Snapshot
- This is a 2 × 3-bed/1-bath units multifamily listed at $190k.
Deal economics
- At list price, monthly cash flow is $933 ($11k/yr) — positive. Per door: $467/mo.
- The deal already cash-flows at list — no discount required.
- Meets the 1% rule at list price ($3k rent vs $190k).
- Recommended offer: $187k (1.5% below list) — sets the bar for market timing.
- Cap rate 12.2% vs local median 3.0% in Jersey Shore — top-decile yield for the area; either an underpriced asset or a hidden risk that comps aren't pricing in. Stress-test before assuming the spread holds.
Location & tenants
- Location reads 74/100 on livability (#490 in PA, #4,504 nationally) — a middle-class / working-renter tenant base. Strengths: cost of living A+, housing A+, health & safety A+; Watch: amenities F, commute F, employment D-.
- Jersey Shore Area SD (town): math 41% / reading 59% proficiency, ranked #179 of 539 in PA (top 33%) — acceptable for families but not a draw, mixed tenant base, ~2y average lease.
- Market conditions: 46 active listings in the ZIP; 73 units permitted in Lycoming County in 2024 (15 in 5+ unit buildings).
Forward outlook
- Local home prices are declining (-3.0%/yr); year-one equity from $1k of loan paydown is wiped out by about $6k of value loss. Plan a longer hold.
- Lycoming County population projected to shrink 10% by 2050 — rents likely to lag national; underwrite the cash flow, not the appreciation.
- At projected returns (-3.0% appreciation + 3.0% rent growth), your $53k cash investment doubles in ~6 years — after that, you're playing with house money.
Negotiation context
- It's been on market 28 days — a 2% lower offer ($187k) is reasonable based on typical stale-listing flexibility.
Risks & watch-outs
- Watch-outs: built in 1901 — expect roof / HVAC / electrical / plumbing capex.
Questions for the listing agent
- Can we see the unit-by-unit rent roll, current vacancy, and any below-market leases? What's the average tenancy length?
- What capital expenditures (roof, boiler, parking lot, exteriors) have been made in the last 5 years, and what's planned in the next 2?
- Built in 1901 — when were the roof, HVAC, electrical panel, plumbing, and water heater last replaced?
- Is there a deadline driving the sale (1031 exchange, divorce, estate, relocation)? That informs how much negotiation room exists.
- Schools are B-rated — typically a magnet for longer-tenancy family renters. What's the average tenant stay here, and is there a school-zone premium baked into asking?
- What's the average days-on-market for RENTAL listings here right now (not sales)? A rising rental-DOM trend means longer vacancies and softer asking-rent achievability than the comps imply.
- What's the recent tenant-quality profile in this submarket — average credit score on applications, eviction rate, late-payment / NSF rate, and stable-employment percentage? A property-management company in the area should have these aggregated.
- How much new apartment / multifamily construction is in the pipeline within 1–3 miles? Heavy new supply (>2% of stock underway) typically softens rents 12–24 months out; light construction supports rent growth.
Investment metrics
- 1% rule
- 1.52% ✓
- Cap rate
- 12.19%
- Cash-on-cash
- 21.06%
- DSCR
- 1.94
- GRM
- 5.5
CMA / ARV
No comps found within radius.
Projected returns pro-forma
-3.0% appreciation · 3.0% rent growth · sell at horizon
- IRR
- 13.5%
- Equity multiple
- 1.54×
- Total profit
- $28,729
- Equity at exit
- $28,315
- IRR
- 22.4%
- Equity multiple
- 2.92×
- Total profit
- $101,826
- Equity at exit
- $16,419
Cash invested: $53,172 (down + closing). Projections, not guarantees.
Landlord ↔ Tenant lean methodology
- Overall (STATE)
- 62 Landlord-Friendly
- State Pennsylvania
- 62 Landlord-Friendly · EVEN
- County
- — inherits STATE
- City
- — inherits STATE
ZIP-level market 17740
- Home prices YoY
- -7.6%
- Active inventory
- 46
- Price-to-rent
- 10.9×
Monthly cashflow live
- Estimated rent
- $2,895 medium interval (Pro) →
- Mortgage (P&I)
- −$996
- Tax from tax record
- −$279 /mo · $3,347/yr
- Insurance
- −$79
- HOA
- −$0
- Vacancy / Maint / Mgmt
- −$608
- Net cashflow
- $933
Break-even live
2-unit breakdown (identical units grouped — click to expand)
| Units | Beds | Baths | Est. rent |
|---|---|---|---|
| 2× units | 3 | 1 | $2,894 |
| #1 | 3 | 1 | $1,447 |
| #2 | 3 | 1 | $1,447 |
| Total (2 units) | $2,895 | ||
UW: 25.0% down · 7.5% · 30yr · 1.5% tax · 5.0% vac · 8.0% maint · 8.0% mgmt
Financing live
Cash to close
- Down payment
- $47,475
- Closing costs
- $5,697
- Reserves months
- —
- Total cash needed
- —
Loan-product check · same deal, 3 products live
Conventional
25% down · 7.5% · 30yr
- Down + closing
- —
- Monthly P&I
- —
- Monthly cashflow
- —
- DSCR
- —
- Eligible?
- —
Personal DTI + credit; lowest rate.
DSCR
20% down · 8.5% · 30yr
- Down + closing
- —
- Monthly P&I
- —
- Monthly cashflow
- —
- DSCR
- —
- Eligible?
- —
No personal income docs; deal must DSCR.
Hard money
10% down · 12.0% · 12mo
- Down + closing
- —
- Monthly P&I
- —
- Monthly cashflow
- —
- DSCR
- —
- Eligible?
- —
Short-term bridge; refi at stabilization.
Listing history 16 events
-
2026-06-19days on market $189,900 Active 28 DOM
-
2026-06-18days on market $189,900 Active 27 DOM
-
2026-06-17days on market $189,900 Active 26 DOM
-
2026-06-16days on market $189,900 Active 25 DOM
-
2026-06-15days on market $189,900 Active 24 DOM
-
2026-06-14days on market $189,900 Active 22 DOM
-
2026-06-12days on market $189,900 Active 21 DOM
-
2026-06-09days on market $189,900 Active 18 DOM
-
2026-06-08days on market $189,900 Active 17 DOM
-
2026-06-07days on market $189,900 Active 16 DOM
-
2026-06-04days on market $189,900 Active 12 DOM
-
2026-06-02days on market $189,900 Active 11 DOM
-
2026-06-01days on market $189,900 Active 10 DOM
-
2026-05-31days on market $189,900 Active 9 DOM
-
2026-05-31days on market $189,900 Active 8 DOM
-
2026-05-22$189,900 Active
ⓘ Source: listings_history table (triggers on properties + properties_extension) + one-shot
backfill from property_details.listing_events for pre-trigger history.
Tax reassessment forecast PA · Partial reset (capped growth)
- Current annual tax
- $3,347 · $279/mo
- Projected year-2 tax
- $3,347 · $279/mo
- Expected delta
- $0/yr ($0/mo · 0.0%)
ⓘ Screening estimate from a state-policy table — verify with the county assessor before closing.
Climate risk First Street
- Flood 1/10 Low FEMA zone X (unshaded) · 0% chance over 30 yrs
- Wildfire 3/10 Moderate
- Heat 4/10 Moderate 7 d/yr ≥98°F today · 16 d/yr by 30 yrs out
- Wind 2/10 Low
- Air quality 1/10 Low 0 unhealthy d/yr today · 0 by 30 yrs out
Nearby sold comps map
Loading sold comps map…
Walkable amenities ~0.75 mi
Loading nearby amenities…
Taxation est. · year 1
- Rental income
- $34,740
- − Mortgage interest
- −$10,637
- − Property taxes
- −$3,347
- − Insurance
- −$950
- − Repairs & maintenance
- −$2,779
- − Management
- −$2,779
- − Depreciation
- −$5,524
- Taxable income
- $8,723
- Est. tax owed @ 24.0%
- −$2,094
- After-tax cash flow
- $9,104/yr
For passive investors: Depreciation is non-cash, so a rental often shows a tax loss while cash-flowing — sheltering income. Rental losses are passive: they offset passive income freely, and up to $25,000/yr can offset ordinary (W-2) income if you actively participate and your MAGI is under $100k (phasing out to $0 by $150k); unused losses carry forward. On sale, claimed depreciation is recaptured at up to 25%, and gains may owe capital-gains tax (a 1031 exchange can defer both). Figures are a year-1 estimate at your 24.0% rate — not tax advice; consult a CPA.
Schools (NCES district)
- District
- Jersey Shore Area SD
- NCES district ID
- 4212480
- Math proficiency
- 41% ▼ -8.00%
- Reading proficiency
- 59% ▼ -7.00%
- Median HH income
- $50,019
- Composite
- 42.72/100
- National rank
- #3165
- State rank
- #179 of 539 in PA
Livability — Jersey Shore
- Score
- 74/100
- State rank
- #490
- US rank
- #4504
Category grades
Schools grade is shown separately in the Schools card above.
Census & demographics
- Census place
- Jersey Shore, PA
- Population (ZIP)
- 11,600
Population outlook (Lycoming County) Hauer SSP2
- Today (2025)
- 114,164 people
- By 2030
- 112,221 · -1.7%
- By 2040
- 107,613 · -5.7%
- By 2050
- 102,950 · -9.8%
- By 2075
- 92,987 · -18.5%
- By 2100
- 80,924 · -29.1%
Race, ethnicity, and origin ACS 2023
- Neighborhood character
- Predominantly White (96%)
- Race & ethnicity
- White 96% Two or more races 2%
- Common ancestry
- Romanian 3% Slovak 2% Polish 1%
- Foreign-born
- 1% · Canada
- Languages at home
- 98% English-only · German/W. Germanic 2%
Political lean MEDSL · Lycoming
- 2024 margin
- Solid R (+41.5) · D 28.8% · R 70.3%
- 2008→2024 swing
- -17.3pp toward R · 2008: -24.2pp · 2024: -41.5pp
- All cycles
- 2024: R+41.5 2020: R+41.3 2016: R+44.8 2012: R+33.3 2008: R+24.2
Not yet ingested
- Civics
- —
Market trends
- HPI YoY
- ▼ -18.78%
- Current HPI
- 229.4555
- Rent YoY
- —
- Metro
- —
- State GDP YoY
- ▲ 1.68%
- F500 in state
- 34
Industry mix (Fortune 500 HQ in PA)
| Industry | F500 HQs | Revenue |
|---|---|---|
| Healthcare | 2 | $309B |
|
||
| Insurance | 2 | $27B |
|
||
| Telecommunications / Media | 1 | $124B |
|
||
| Industrial Distribution | 1 | $22B |
|
||
| Financial Services | 1 | $20B |
|
||
| Chemicals / Materials | 1 | $18B |
|
||
Price history
1 event — show timeline
- 2026-05-22 Listed $189,900 WBVAR
Property tax history
+1.9%/yrLatest (2026): $3,347 · +1.2% YoY. Source: county tax records.
Cash-flow waterfall
monthlySold comps — $/sqft
last 12 mo · ≤1 miLoading sold comps…