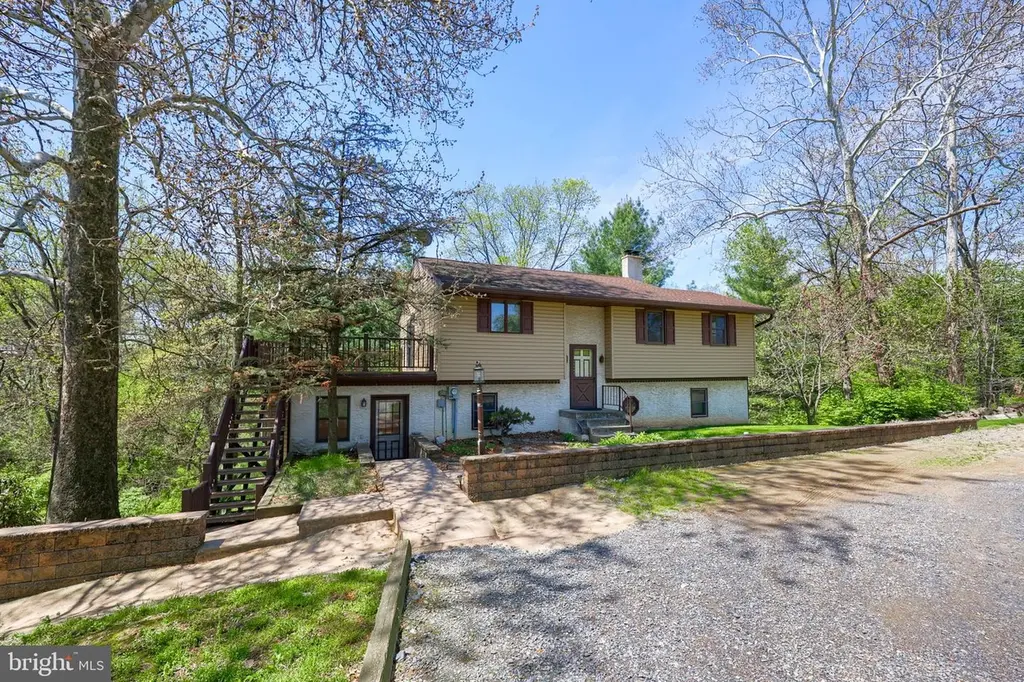
242 Skyview Ln
Brownstown, PA 17543
$375,000F
3 bd · 1.5 ba ·
1,002 sqft ·
Built 1958
· SingleFamily
· Pending
· 5 DOM
Cashflow @ list (25.0% down · 7.5%)
Estimated rent
$2,039/mo
Mortgage (P&I)
−$1,967
Tax + insurance
−$425
HOA
−$0
Vac / Maint / Mgmt
−$428
Net cashflow
$-781/mo
Annual
$-9,372/yr
Cap rate
3.79%
Cash-on-cash
-8.93%
DSCR
0.60
1% rule
0.54%
Cash to close
$105,000
Investor read
- This is a 3-bed/1.5-bath single-family listed at $375k.
- At list price, monthly cash flow is $-781 ($-9k/yr) — negative.
- To cash-flow at today's rent, offer at most $237k (36.8% below list).
- To meet the 1% rule (rent ≥ 1% of price), the offer needs to be $204k (45.6% below list).
- Only 5 days on market — expect competitive offers; lowballing is unlikely to land.
- Recommended offer: $204k (45.6% below list) — sets the bar for 1% rule.
- Local home prices are declining (-3.0%/yr); year-one equity from $3k of loan paydown is wiped out by about $11k of value loss. Plan a longer hold.
- Location reads 71/100 on livability (#653 in PA) — a middle-class / working-renter tenant base. Strengths: crime A+, employment A+, housing A+; Watch: amenities F, commute F.
- Warwick SD (suburban): math 42% / reading 58% proficiency, ranked #158 of 539 in PA (top 29%) — acceptable for families but not a draw, mixed tenant base, ~2y average lease; only 20% free/reduced lunch — higher-income household profile.
- Zoned schools: John R Bonfield El Sch (math 35% / reading 55%, grade D-, #809 of 1,518 statewide, top 54%, 476 students, 45% FRL); Warwick Ms (math 23% / reading 57%, grade F, #257 of 512 statewide, top 52%, 578 students, 35% FRL); Warwick Shs (math 86% / reading 50%, grade B, #59 of 437 statewide, top 14%, 1,230 students, 28% FRL) — zoned schools average 36% FRL vs 20% district-wide (16 pts higher); higher-poverty schools than district average — tighter screening recommended.
- Watch-outs: built in 1958 — expect roof / HVAC / electrical / plumbing capex.
- Market conditions: 218 active listings in the ZIP; 1 comparable units currently listed for rent nearby; solid renter incomes; 1,093 units permitted in Lancaster County in 2024 (201 in 5+ unit buildings).
- Lancaster County population projected at +5% by 2050 — modest demand growth; plan on rents tracking national, not racing it.
- Climate carrying-cost: extreme-heat days projected 7→15/yr by 2055 (HVAC capex compounding) — expect insurance premiums to compound above CPI over the hold.
Questions for listing agent
- What do current leases actually rent for vs. the listed asking? Can we see a recent rent roll and the last 12 months of T-12 income?
- Built in 1958 — when were the roof, HVAC, electrical panel, plumbing, and water heater last replaced?
- Is there a deadline driving the sale (1031 exchange, divorce, estate, relocation)? That informs how much negotiation room exists.
- The area grade is low — what's the realistic commute time and amenity access for the typical tenant pool here? Any planned neighborhood developments (good or bad) we should know about?
- What's the average days-on-market for RENTAL listings here right now (not sales)? A rising rental-DOM trend means longer vacancies and softer asking-rent achievability than the comps imply.
- What's the recent tenant-quality profile in this submarket — average credit score on applications, eviction rate, late-payment / NSF rate, and stable-employment percentage? A property-management company in the area should have these aggregated.
- How much new for-sale + rental construction is in the pipeline within 1–3 miles? Heavy new supply typically softens prices + rents 12–24 months out; constrained supply supports both.
CashFlowRE · CFR-K0TS0G2T7NENNX
· Data 3 weeks ago
cashflowre.app · 2026-05-29