242 Skyview Ln · Brownstown, PA
Flood risk 1/10 · Minimal
- FEMA flood zone
- X (unshaded)
- Chance of flooding over 30 yrs
- 0.0%
- Est. flood insurance / yr
- $473 – $860
Fire risk 1/10 · Minimal
- Est. fire insurance / yr
- $511 – $949
Heat risk 5/10 · Moderate
- Hot days now (above 102°F)
- 7 days/yr
- Hot days in 30 yrs
- 15 days/yr
Wind risk 4/10 · Minor
- Chance of severe wind over 30 yrs
- 17.0%
Air-quality risk 4/10 · Minor
- Unhealthy air days now
- 5 days/yr
- Unhealthy air days in 30 yrs
- 7 days/yr
Risk factors via First Street. Map © Google.
Why this score? — see what drove the F grade
The composite is a weighted blend of 9 inputs, each scored 0–100. Each bar is that input's sub-score; the figure is the points it added to the 100-point composite (weight × sub-score).
- ARV discount +11.5/15.0
- Cash flow +5.6/30.0
- Schools +4.4/10.0
- Livability +3.6/5.0
- Rent growth +2.5/5.0
- Condition / age +2.5/5.0
- 1% rule +0.4/10.0
- DSCR +0.0/10.0
- Appreciation +0.0/10.0
$375,000
🖨 Deal sheet (PDF) 📄 Offer letter ✓ Due diligence
Listing remarks
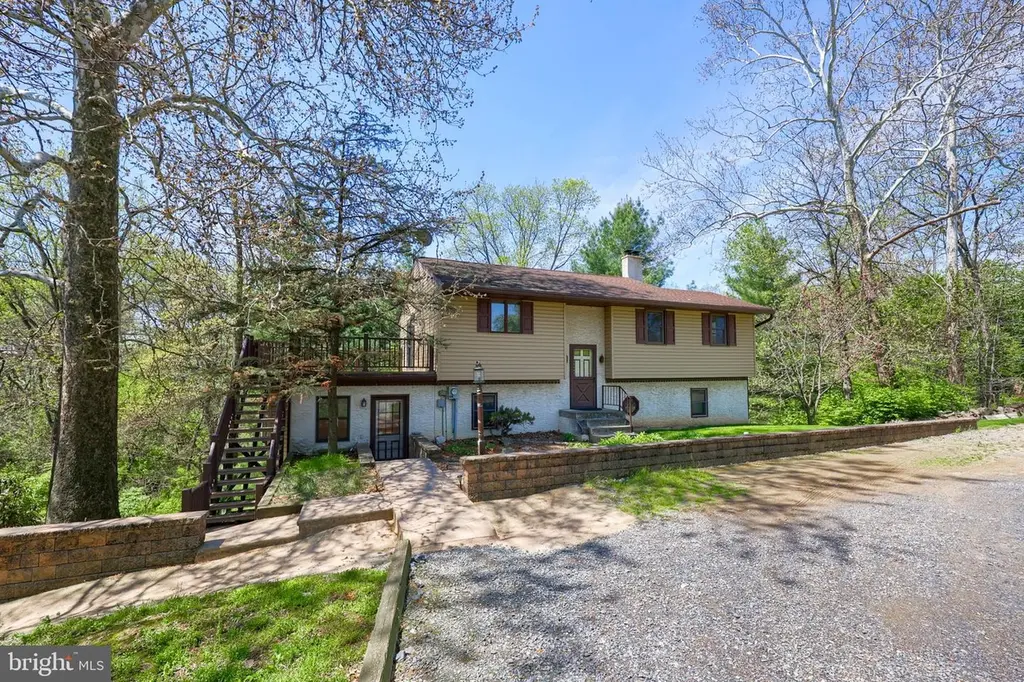
Set on a scenic . 9-acre lot in a wooded setting that backs to a stream and overlooks preserved farmland across the street, this Warwick Township home offers a peaceful backdrop with everyday convenience just minutes from Rt 222. Originally a one-story home, the property was fully rebuilt in 1985 on the existing foundation, creating a spacious layout that now includes 4 bedrooms and 1.5 baths. Inside, you’ll find a custom-designed kitchen that serves as the heart of the home, flowing easily into the main living areas and out to a large composite deck—perfect for relaxing or entertaining while taking in the natural surroundings. The lower level expands your living space with a co
Key facts
- 0.9 acre lot
- Built 1958
- Listed 5 days
Property features AI
Exterior
- Parking: Driveway
- Utilities: On-site septic system; Spring water source
- Home design: Detached property; Estimated year of major remodel 1985; Ownership: Fee simple
- Construction: Frame construction with vinyl siding; Block foundation
- Exterior features: Not in a federal flood zone; Other structures above and below grade
Interior
- Bedrooms: Two bedrooms on the main level; Two bedrooms on the lower level
- Bathrooms: One full bathroom; One half bathroom on the lower level
- Heating & cooling: Forced air heating (oil-fired); Central air conditioning (electric); Electric hot water
- Interior features: Estimated living area; Walkout, full, partially finished basement
Neighborhood map
What this means for you Summary
Snapshot
- This is a 3-bed/1.5-bath single-family listed at $375k.
Deal economics
- At list price, monthly cash flow is $-781 ($-9k/yr) — negative.
- To cash-flow at today's rent, offer at most $237k (36.8% below list).
- To meet the 1% rule (rent ≥ 1% of price), the offer needs to be $204k (45.6% below list).
- Recommended offer: $204k (45.6% below list) — sets the bar for 1% rule.
Location & tenants
- Location reads 71/100 on livability (#653 in PA) — a middle-class / working-renter tenant base. Strengths: crime A+, employment A+, housing A+; Watch: amenities F, commute F.
- Warwick SD (suburban): math 42% / reading 58% proficiency, ranked #158 of 539 in PA (top 29%) — acceptable for families but not a draw, mixed tenant base, ~2y average lease; only 20% free/reduced lunch — higher-income household profile.
- Zoned schools: John R Bonfield El Sch (math 35% / reading 55%, grade D-, #809 of 1,518 statewide, top 54%, 476 students, 45% FRL); Warwick Ms (math 23% / reading 57%, grade F, #257 of 512 statewide, top 52%, 578 students, 35% FRL); Warwick Shs (math 86% / reading 50%, grade B, #59 of 437 statewide, top 14%, 1,230 students, 28% FRL) — zoned schools average 36% FRL vs 20% district-wide (16 pts higher); higher-poverty schools than district average — tighter screening recommended.
- Market conditions: 218 active listings in the ZIP; 1 comparable units currently listed for rent nearby; solid renter incomes; 1,093 units permitted in Lancaster County in 2024 (201 in 5+ unit buildings).
Forward outlook
- Local home prices are declining (-3.0%/yr); year-one equity from $3k of loan paydown is wiped out by about $11k of value loss. Plan a longer hold.
- Lancaster County population projected at +5% by 2050 — modest demand growth; plan on rents tracking national, not racing it.
Negotiation context
- Only 5 days on market — expect competitive offers; lowballing is unlikely to land.
Risks & watch-outs
- Watch-outs: built in 1958 — expect roof / HVAC / electrical / plumbing capex.
- Climate carrying-cost: extreme-heat days projected 7→15/yr by 2055 (HVAC capex compounding) — expect insurance premiums to compound above CPI over the hold.
Questions for the listing agent
- What do current leases actually rent for vs. the listed asking? Can we see a recent rent roll and the last 12 months of T-12 income?
- Built in 1958 — when were the roof, HVAC, electrical panel, plumbing, and water heater last replaced?
- Is there a deadline driving the sale (1031 exchange, divorce, estate, relocation)? That informs how much negotiation room exists.
- The area grade is low — what's the realistic commute time and amenity access for the typical tenant pool here? Any planned neighborhood developments (good or bad) we should know about?
- What's the average days-on-market for RENTAL listings here right now (not sales)? A rising rental-DOM trend means longer vacancies and softer asking-rent achievability than the comps imply.
- What's the recent tenant-quality profile in this submarket — average credit score on applications, eviction rate, late-payment / NSF rate, and stable-employment percentage? A property-management company in the area should have these aggregated.
- How much new for-sale + rental construction is in the pipeline within 1–3 miles? Heavy new supply typically softens prices + rents 12–24 months out; constrained supply supports both.
Investment metrics
- 1% rule
- 0.54% ✗
- Cap rate
- 3.79%
- Cash-on-cash
- -8.93%
- DSCR
- 0.60
- GRM
- 15.3
CMA / ARV
- ARV (median comp)
- $411,461
- List price
- $375,000
- Delta
- -8.86%
- Verdict
- FAIR
- Comps
- 20 within 1.0 mi
Show comp detail 1 sale within ~0.75 mi
| Address | Dist | Beds/Ba | Sqft | Sold | Price | $/sf | Match |
|---|---|---|---|---|---|---|---|
| 33 Opal Dr | 0.12mi | 3/2.0 | 1,127 (+12%) | 10mo | $50,000 | $44 | 63 |
Match score weights: distance 35% · size 25% · config 20% · recency 20%. Top-matched comps best support the ARV.
Projected returns pro-forma
-3.0% appreciation · 3.0% rent growth · sell at horizon
- IRR
- -32.2%
- Equity multiple
- -0.05×
- Total profit
- $-110,600
- Equity at exit
- $55,914
- IRR
- -37.5%
- Equity multiple
- -0.53×
- Total profit
- $-160,734
- Equity at exit
- $32,423
Cash invested: $105,000 (down + closing). Projections, not guarantees.
Landlord ↔ Tenant lean methodology
- Overall (STATE)
- 62 Landlord-Friendly
- State Pennsylvania
- 62 Landlord-Friendly · EVEN
- County
- — inherits STATE
- City
- — inherits STATE
ZIP-level market 17543
- Active inventory
- 218
- Price-to-rent
- 15.3×
Monthly cashflow live
- Estimated rent
- $2,039 medium interval (Pro) →
- Mortgage (P&I)
- −$1,967
- Tax from tax record
- −$269 /mo · $3,225/yr
- Insurance
- −$156
- HOA
- −$0
- Vacancy / Maint / Mgmt
- −$428
- Net cashflow
- $-781
Break-even live
Sensitivity live
| Price | -10% $-569 | -5% $-675 | +0% $-781 | +5% $-887 | +10% $-993 |
|---|---|---|---|---|---|
| Rent | -10% $-942 | -5% $-862 | +0% $-781 | +5% $-700 | +10% $-620 |
| Rate | -1.0pp $-592 | -0.5pp $-686 | base $-781 | +0.5pp $-878 | +1.0pp $-977 |
UW: 25.0% down · 7.5% · 30yr · 1.5% tax · 5.0% vac · 8.0% maint · 8.0% mgmt
Financing live
Cash to close
- Down payment
- $93,750
- Closing costs
- $11,250
- Reserves months
- —
- Total cash needed
- —
Loan-product check · same deal, 3 products live
Conventional
25% down · 7.5% · 30yr
- Down + closing
- —
- Monthly P&I
- —
- Monthly cashflow
- —
- DSCR
- —
- Eligible?
- —
Personal DTI + credit; lowest rate.
DSCR
20% down · 8.5% · 30yr
- Down + closing
- —
- Monthly P&I
- —
- Monthly cashflow
- —
- DSCR
- —
- Eligible?
- —
No personal income docs; deal must DSCR.
Hard money
10% down · 12.0% · 12mo
- Down + closing
- —
- Monthly P&I
- —
- Monthly cashflow
- —
- DSCR
- —
- Eligible?
- —
Short-term bridge; refi at stabilization.
Rent comps 1 comps
| Address | Beds | Baths | Sqft | Rent | $/sqft | DOM | Units | Dist |
|---|---|---|---|---|---|---|---|---|
| 217 S 9th St Akron, PA | 3.0 | 1.5 | 1176 | $1,495 | $1.27 | 15d | 1 | 1.27mi |
Listing history 4 events
-
2026-05-13status Pending 1103-char remark
-
2026-05-08$375,000 Active 1103-char remark
-
2026-05-04historical $375,000 1103-char remark
-
1975-11-26soldstatus $21,000
ⓘ Source: listings_history table (triggers on properties + properties_extension) + one-shot
backfill from property_details.listing_events for pre-trigger history.
Tax reassessment forecast PA · Partial reset (capped growth)
- Current annual tax
- $3,225 · $269/mo
- Projected year-2 tax
- $4,575 · $381/mo
- Expected delta
- +$1,350/yr (+$113/mo · 41.9%)
ⓘ Screening estimate from a state-policy table — verify with the county assessor before closing.
Climate risk First Street
- Flood 1/10 Low FEMA zone X (unshaded) · 0% chance over 30 yrs
- Wildfire 1/10 Low
- Heat 5/10 Major 7 d/yr ≥102°F today · 15 d/yr by 30 yrs out
- Wind 4/10 Moderate 17% chance of damaging wind over 30 yrs
- Air quality 4/10 Moderate 5 unhealthy d/yr today · 7 by 30 yrs out
Nearby sold comps map
Loading sold comps map…
Walkable amenities ~0.75 mi
Loading nearby amenities…
Taxation est. · year 1
- Rental income
- $24,464
- − Mortgage interest
- −$21,006
- − Property taxes
- −$3,225
- − Insurance
- −$1,875
- − Repairs & maintenance
- −$1,957
- − Management
- −$1,957
- − Depreciation
- −$10,909
- Taxable loss
- −$16,465
- Est. tax savings @ 24.0%
- +$3,952
- After-tax cash flow
- $-5,420/yr
For passive investors: Depreciation is non-cash, so a rental often shows a tax loss while cash-flowing — sheltering income. Rental losses are passive: they offset passive income freely, and up to $25,000/yr can offset ordinary (W-2) income if you actively participate and your MAGI is under $100k (phasing out to $0 by $150k); unused losses carry forward. On sale, claimed depreciation is recaptured at up to 25%, and gains may owe capital-gains tax (a 1031 exchange can defer both). Figures are a year-1 estimate at your 24.0% rate — not tax advice; consult a CPA.
Schools (NCES district)
- District
- Warwick SD
- NCES district ID
- 4224960
- Math proficiency
- 42% ▼ -6.00%
- Reading proficiency
- 58% ▼ -11.00%
- Median HH income
- $63,696
- Composite
- 44.03/100
- National rank
- #2884
- State rank
- #158 of 539 in PA
Livability — Brownstown
- Score
- 71/100
- State rank
- #653
- US rank
- #6659
Category grades
Schools grade is shown separately in the Schools card above.
Census & demographics
- County
- Lancaster County · 390,309 people
- City population
- 1,027
- Metro
- Lancaster, PA
- Population (ZIP)
- 45,912
- Household income
- $97,435
- Rent vs Own
- Severe rent burden
- 1164.0
Population outlook (Lancaster County) Hauer SSP2
- Today (2025)
- 561,011 people
- By 2030
- 570,969 · +1.8%
- By 2040
- 585,929 · +4.4%
- By 2050
- 591,056 · +5.4%
- By 2075
- 594,747 · +6.0%
- By 2100
- 558,850 · -0.4%
Race, ethnicity, and origin ACS 2023
- Neighborhood character
- Predominantly White (86%)
- Race & ethnicity
- White 86% Hispanic / Latino 6% Two or more races 5% Asian 3% Black 2%
- Hispanic origin (detail)
- Mexican 1% Puerto Rican 3%
- Common ancestry
- Romanian 3% Lithuanian 2% Italian 2%
- Foreign-born
- 4% · Canada, India, Vietnam
- Languages at home
- 92% English-only · Spanish 3% German/W. Germanic 2% Other Indo-European 1%
Political lean MEDSL · Lancaster
- 2024 margin
- R (+15.9) · D 41.5% · R 57.5%
- 2008→2024 swing
- -4.1pp toward R · 2008: -11.8pp · 2024: -15.9pp
- All cycles
- 2024: R+15.9 2020: R+15.8 2016: R+19.7 2012: R+19.2 2008: R+11.8
Not yet ingested
- Civics
- —
Market trends
- HPI YoY
- ▼ -283.22%
- Current HPI
- 265.3653
- Rent YoY
- —
- Metro
- Lancaster, PA
- State GDP YoY
- ▲ 1.68%
- F500 in state
- 34
Industry mix (Fortune 500 HQ in PA)
| Industry | F500 HQs | Revenue |
|---|---|---|
| Healthcare | 2 | $309B |
|
||
| Insurance | 2 | $27B |
|
||
| Telecommunications / Media | 1 | $124B |
|
||
| Industrial Distribution | 1 | $22B |
|
||
| Financial Services | 1 | $20B |
|
||
| Chemicals / Materials | 1 | $18B |
|
||
Price history
+1757.1% since first listed5 events — show timeline
- 2026-06-15 Sold (MLS) $390,000 BRIGHT MLS
- 2026-05-13 Pending — BRIGHT MLS
- 2026-05-08 Listed $375,000 BRIGHT MLS
- 2026-05-04 Coming Soon $375,000 BRIGHT MLS
- 1975-11-26 Sold (Public Records) $21,000 Public Records
Property tax history
+0.7%/yrLatest (2026): $3,225 · +2.1% YoY. Source: county tax records.
Cash-flow waterfall
monthlySold comps — $/sqft
last 12 mo · ≤1 miLoading sold comps…