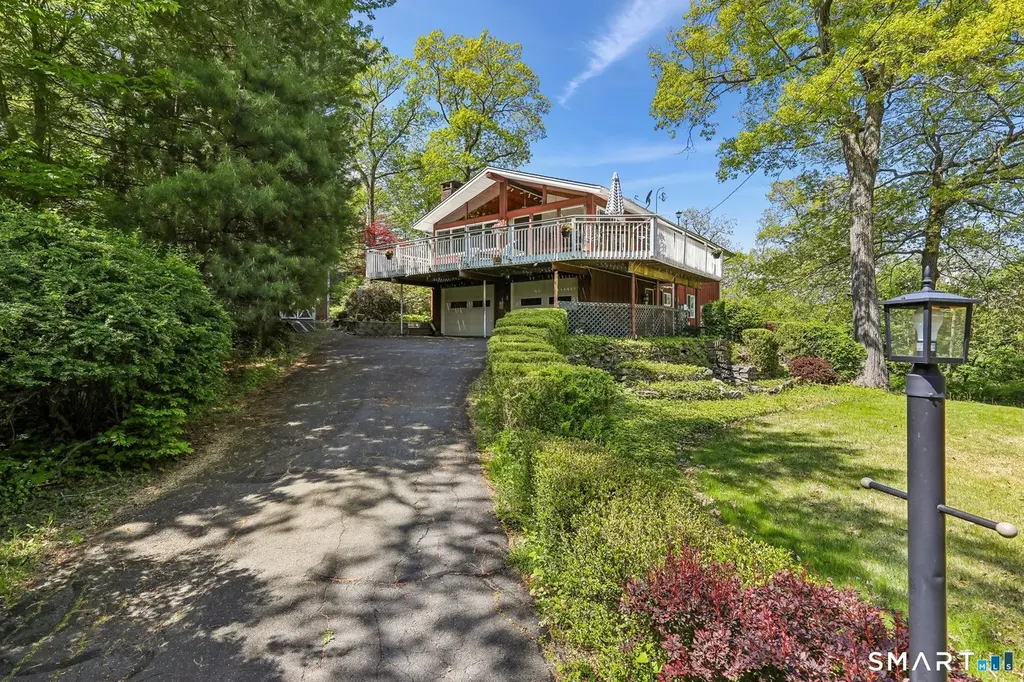
4 Alan Rd
Danbury, CT 06810
$599,900D
4 bd · 2.0 ba ·
2,504 sqft ·
Built 1965
· SingleFamily
· Active
· 38 DOM
Cashflow @ list (25.0% down · 7.5%)
Estimated rent
$4,954/mo
Mortgage (P&I)
−$3,146
Tax + insurance
−$813
HOA
−$365
Vac / Maint / Mgmt
−$1,040
Net cashflow
$-410/mo
Annual
$-4,923/yr
Cap rate
5.47%
Cash-on-cash
-2.93%
DSCR
0.87
1% rule
0.83%
Cash to close
$167,972
Investor read
- This is a 4-bed/2.0-bath single-family listed at $600k.
- At list price, monthly cash flow is $-410 ($-5k/yr) — negative.
- To cash-flow at today's rent, offer at most $527k (12.1% below list).
- To meet the 1% rule (rent ≥ 1% of price), the offer needs to be $495k (17.4% below list).
- It's been on market 38 days — a 3% lower offer ($582k) is reasonable based on typical stale-listing flexibility.
- Recommended offer: $495k (17.4% below list) — sets the bar for 1% rule.
- Local home prices are declining (-3.0%/yr); year-one equity from $4k of loan paydown is wiped out by about $18k of value loss. Plan a longer hold.
- Location reads 76/100 on livability (#51 in CT, #3,379 nationally) — a middle-class / working-renter tenant base. Strengths: commute A+, housing A+, health & safety A+; Watch: amenities F, cost of living F.
- Danbury School District (urban): math 19% / reading 32% proficiency, ranked #131 of 153 in CT (top 86%) — low school quality limits family demand, transient renter base, plan for 1-2y turnover.
- Zoned schools: Danbury High School (math 19% / reading 41%, grade F, #137 of 194 statewide, top 70%, 3,590 students, 48% FRL).
- Market conditions: Rents rising (+3.1%/yr); 200 active listings in the ZIP; 3 comparable units currently listed for rent nearby; rentals lingering (median 46d on market — plan ~5-8 weeks vacancy on turnover, expect pricing pressure); 67% of comp listings sitting > 30 days — soft ceiling on asking rent; solid renter incomes; 1,151 units permitted in Western Connecticut Planning Region in 2024 (714 in 5+ unit buildings).
- 5 sale attempts since 9y ago with the ask held roughly flat each time — persistent listings suggest the price (not the market) is what's stuck; bring a comps-based counter.
- Climate carrying-cost: major wind risk, 27% chance of damaging wind over 30y — expect insurance premiums to compound above CPI over the hold.
- Cap rate 5.5% vs local median 3.6% in Danbury — top-decile yield for the area; either an underpriced asset or a hidden risk that comps aren't pricing in. Stress-test before assuming the spread holds.
- At $4,954/mo this rent would consume 77% of the median local household income ($77k/yr) (locally 3255% of renters already pay >50% of income on rent) — very limited rent-growth headroom before tenants either downsize or default.
Questions for listing agent
- What do current leases actually rent for vs. the listed asking? Can we see a recent rent roll and the last 12 months of T-12 income?
- It's been on market 38 days. Have you received any prior offers? Is the seller open to a 17% concession, seller financing, or rate buy-down credit?
- Built in 1965 — when were the roof, HVAC, electrical panel, plumbing, and water heater last replaced?
- What does the HOA fee cover, when was the last increase, and are there any pending special assessments or reserve-fund shortfalls?
- Is there a deadline driving the sale (1031 exchange, divorce, estate, relocation)? That informs how much negotiation room exists.
- Schools are D-rated, which usually means shorter tenancies and higher turnover. Who's the typical renter profile here, and what's been the actual vacancy rate?
- The area grade is low — what's the realistic commute time and amenity access for the typical tenant pool here? Any planned neighborhood developments (good or bad) we should know about?
- What's the average days-on-market for RENTAL listings here right now (not sales)? A rising rental-DOM trend means longer vacancies and softer asking-rent achievability than the comps imply.
CashFlowRE · CFR-K1JN7A1S4E2B1Q
· Data 12 h ago
cashflowre.app · 2026-05-29