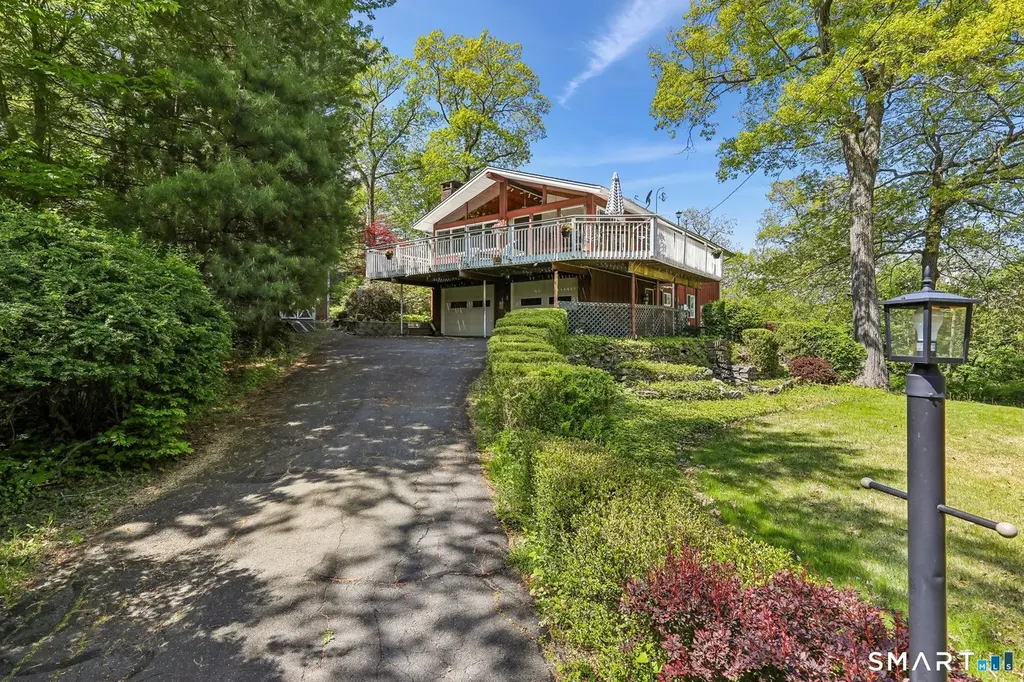
4 Alan Rd · Danbury, CT
Flood risk 1/10 · Minimal
- FEMA flood zone
- X (unshaded)
- Chance of flooding over 30 yrs
- 0.0%
- Est. flood insurance / yr
- $473 – $860
Fire risk 3/10 · Minor
- Est. fire insurance / yr
- $829 – $1,539
Heat risk 4/10 · Minor
- Hot days now (above 98°F)
- 7 days/yr
- Hot days in 30 yrs
- 15 days/yr
Wind risk 6/10 · Moderate
- Chance of severe wind over 30 yrs
- 27.0%
Air-quality risk 4/10 · Minor
- Unhealthy air days now
- 3 days/yr
- Unhealthy air days in 30 yrs
- 5 days/yr
Risk factors via First Street. Map © Google.
Why this score? — see what drove the D grade
The composite is a weighted blend of 9 inputs, each scored 0–100. Each bar is that input's sub-score; the figure is the points it added to the 100-point composite (weight × sub-score).
- ARV discount +15.0/15.0
- Cash flow +9.6/30.0
- Livability +3.8/5.0
- 1% rule +3.3/10.0
- Rent growth +3.3/5.0
- DSCR +2.7/10.0
- Condition / age +2.5/5.0
- Schools +2.4/10.0
- Appreciation +0.0/10.0
$599,900
🖨 Deal sheet (PDF) 📄 Offer letter ✓ Due diligence
Listing remarks
Set within a desirable gated community in western Connecticut, this striking contemporary home offers the perfect blend of style, comfort, and convenience. Featuring over 2,500 square feet of thoughtfully designed living space, this spacious four-bedroom, two-full-bath residence is ideal for both entertaining and everyday living. Sun-filled interiors, an open-concept layout, and seamless flow create an inviting atmosphere throughout. The sun-filled main living area showcases soaring cathedral ceilings, dramatic two-story windows, and beautiful hardwood flooring throughout much of the home. The spacious kitchen is designed for both function and gathering, featuring granite countertops, tile
Key facts
- Gated community
- Updated kitchen
- Master with en-suite
Tags
Property features AI
Finance
- Financial info: Professionally managed off-site
- HOA & community: Homeowners association with monthly fee; HOA fee includes clubhouse, tennis, lake/beach access, and security; Association amenities include basketball court, clubhouse, playground/tot lot, and tennis courts; Monthly HOA fee
Exterior
- Parking: Under-house garage; Two-car garage
- Security: Community security service
- Utilities: Private water system; Septic sewer system; Above-ground fuel tank
- Home design: Single-family home; Located in a gated community
- Construction: Built with wood frame construction; Concrete foundation; Asphalt shingle roof
- Exterior features: Enclosed porch; Deck; Water view; Walk-to-water and community water access/view
Interior
- Kitchen: Cooktop; Wall oven; Microwave; Dishwasher
- Bedrooms: Four bedrooms
- Bathrooms: Two full bathrooms
- Heating & cooling: Ceiling fans; Central air; Hot air heating; Tankless domestic hot water; Propane and electric heat sources; Active solar features; Ridge vents; Storm doors
- Interior features: Seven total rooms; One fireplace; Full walk-out basement
Neighborhood map
What this means for you Summary
Snapshot
- This is a 4-bed/2.0-bath single-family listed at $600k.
Deal economics
- At list price, monthly cash flow is $-410 ($-5k/yr) — negative.
- To cash-flow at today's rent, offer at most $527k (12.1% below list).
- To meet the 1% rule (rent ≥ 1% of price), the offer needs to be $495k (17.4% below list).
- Recommended offer: $495k (17.4% below list) — sets the bar for 1% rule.
- Cap rate 5.5% vs local median 3.6% in Danbury — top-decile yield for the area; either an underpriced asset or a hidden risk that comps aren't pricing in. Stress-test before assuming the spread holds.
Location & tenants
- Location reads 76/100 on livability (#51 in CT, #3,379 nationally) — a middle-class / working-renter tenant base. Strengths: commute A+, housing A+, health & safety A+; Watch: amenities F, cost of living F.
- Danbury School District (urban): math 19% / reading 32% proficiency, ranked #131 of 153 in CT (top 86%) — low school quality limits family demand, transient renter base, plan for 1-2y turnover.
- Zoned schools: Danbury High School (math 19% / reading 41%, grade F, #137 of 194 statewide, top 70%, 3,590 students, 48% FRL).
- Market conditions: Rents rising (+3.1%/yr); 200 active listings in the ZIP; 3 comparable units currently listed for rent nearby; rentals lingering (median 46d on market — plan ~5-8 weeks vacancy on turnover, expect pricing pressure); 67% of comp listings sitting > 30 days — soft ceiling on asking rent; solid renter incomes; 1,151 units permitted in Western Connecticut Planning Region in 2024 (714 in 5+ unit buildings).
- At $4,954/mo this rent would consume 77% of the median local household income ($77k/yr) (locally 3255% of renters already pay >50% of income on rent) — very limited rent-growth headroom before tenants either downsize or default.
Forward outlook
- Local home prices are declining (-3.0%/yr); year-one equity from $4k of loan paydown is wiped out by about $18k of value loss. Plan a longer hold.
Negotiation context
- It's been on market 38 days — a 3% lower offer ($582k) is reasonable based on typical stale-listing flexibility.
- 5 sale attempts since 9y ago with the ask held roughly flat each time — persistent listings suggest the price (not the market) is what's stuck; bring a comps-based counter.
Risks & watch-outs
- Climate carrying-cost: major wind risk, 27% chance of damaging wind over 30y — expect insurance premiums to compound above CPI over the hold.
Questions for the listing agent
- What do current leases actually rent for vs. the listed asking? Can we see a recent rent roll and the last 12 months of T-12 income?
- It's been on market 38 days. Have you received any prior offers? Is the seller open to a 17% concession, seller financing, or rate buy-down credit?
- Built in 1965 — when were the roof, HVAC, electrical panel, plumbing, and water heater last replaced?
- What does the HOA fee cover, when was the last increase, and are there any pending special assessments or reserve-fund shortfalls?
- Is there a deadline driving the sale (1031 exchange, divorce, estate, relocation)? That informs how much negotiation room exists.
- Schools are D-rated, which usually means shorter tenancies and higher turnover. Who's the typical renter profile here, and what's been the actual vacancy rate?
- The area grade is low — what's the realistic commute time and amenity access for the typical tenant pool here? Any planned neighborhood developments (good or bad) we should know about?
- What's the average days-on-market for RENTAL listings here right now (not sales)? A rising rental-DOM trend means longer vacancies and softer asking-rent achievability than the comps imply.
- What's the recent tenant-quality profile in this submarket — average credit score on applications, eviction rate, late-payment / NSF rate, and stable-employment percentage? A property-management company in the area should have these aggregated.
- How much new for-sale + rental construction is in the pipeline within 1–3 miles? Heavy new supply typically softens prices + rents 12–24 months out; constrained supply supports both.
Investment metrics
- 1% rule
- 0.83% ✗
- Cap rate
- 5.47%
- Cash-on-cash
- -2.93%
- DSCR
- 0.87
- GRM
- 10.1
CMA / ARV
- ARV (median comp)
- $773,923
- List price
- $599,900
- Delta
- -22.49%
- Verdict
- UNDERPRICED
- Comps
- 15 within 1.0 mi
Show comp detail 3 sales within ~0.75 mi
| Address | Dist | Beds/Ba | Sqft | Sold | Price | $/sf | Match |
|---|---|---|---|---|---|---|---|
| 12 Sage Rd | 0.29mi | 3/2.0 (-1) | 2,448 (-2%) | 10mo | $780,000 | $319 | 70 |
| 20A Starrs Plain Rd | 0.70mi | 4/2.5 | 2,522 (+1%) | 16mo | $899,000 | $356 | 51 |
| 140 Post Rd | 0.61mi | 4/3.0 | 2,728 (+9%) | 18mo | $850,000 | $312 | 38 |
Match score weights: distance 35% · size 25% · config 20% · recency 20%. Top-matched comps best support the ARV.
Projected returns pro-forma
-3.0% appreciation · 3.08% rent growth · sell at horizon
- IRR
- -21.1%
- Equity multiple
- 0.27×
- Total profit
- $-122,758
- Equity at exit
- $89,447
- IRR
- -14.2%
- Equity multiple
- 0.18×
- Total profit
- $-138,156
- Equity at exit
- $51,868
Cash invested: $167,972 (down + closing). Projections, not guarantees.
Landlord ↔ Tenant lean methodology
- Overall (STATE)
- 27 Tenant-Leaning
- State Connecticut
- 27 Tenant-Leaning · D+7
- County
- — inherits STATE
- City
- — inherits STATE
ZIP-level market 06810
- Rents YoY
- 3.1%
- Active inventory
- 200
- Price-to-rent
- 10.1×
Monthly cashflow live
- Estimated rent
- $4,954 medium interval (Pro) →
- Mortgage (P&I)
- −$3,146
- Tax from tax record
- −$563 /mo · $6,753/yr
- Insurance
- −$250
- HOA
- −$365
- Vacancy / Maint / Mgmt
- −$1,040
- Net cashflow
- $-410
Break-even live
Sensitivity live
| Price | -10% $-71 | -5% $-240 | +0% $-410 | +5% $-580 | +10% $-750 |
|---|---|---|---|---|---|
| Rent | -10% $-802 | -5% $-606 | +0% $-410 | +5% $-215 | +10% $-19 |
| Rate | -1.0pp $-108 | -0.5pp $-258 | base $-410 | +0.5pp $-566 | +1.0pp $-724 |
UW: 25.0% down · 7.5% · 30yr · 1.5% tax · 5.0% vac · 8.0% maint · 8.0% mgmt
Financing live
Cash to close
- Down payment
- $149,975
- Closing costs
- $17,997
- Reserves months
- —
- Total cash needed
- —
Loan-product check · same deal, 3 products live
Conventional
25% down · 7.5% · 30yr
- Down + closing
- —
- Monthly P&I
- —
- Monthly cashflow
- —
- DSCR
- —
- Eligible?
- —
Personal DTI + credit; lowest rate.
DSCR
20% down · 8.5% · 30yr
- Down + closing
- —
- Monthly P&I
- —
- Monthly cashflow
- —
- DSCR
- —
- Eligible?
- —
No personal income docs; deal must DSCR.
Hard money
10% down · 12.0% · 12mo
- Down + closing
- —
- Monthly P&I
- —
- Monthly cashflow
- —
- DSCR
- —
- Eligible?
- —
Short-term bridge; refi at stabilization.
Rent comps 3 comps
| Address | Beds | Baths | Sqft | Rent | $/sqft | DOM | Units | Dist |
|---|---|---|---|---|---|---|---|---|
| 118 Long Ridge Rd Danbury, CT | 5.0 | 3.0 | 3000 | $6,500 | $2.17 | 45d | 1 | 1.05mi |
| 168 Long Ridge Rd Danbury, CT | 4.0 | 2.5 | 2015 | $5,800 | $2.88 | 45d | 1 | 1.16mi |
| 26 Spruce Mountain Rd Danbury, CT | 3.0 | 1.5 | 2040 | $3,650 | $1.79 | 4d | 1 | 1.28mi |
HOA detail
- Monthly dues
- $365 · $4,380/yr
- Likely covers
- security
Listing history 30 events
-
2026-06-22days on market $599,900 Active 38 DOM
-
2026-06-18days on market $599,900 Active 35 DOM
-
2026-06-17days on market $599,900 Active 34 DOM
-
2026-06-16days on market $599,900 Active 33 DOM
-
2026-06-15days on market $599,900 Active 32 DOM
-
2026-06-13days on market $599,900 Active 30 DOM
-
2026-06-10days on market $599,900 Active 27 DOM
-
2026-06-09days on market $599,900 Active 26 DOM
-
2026-06-08days on market $599,900 Active 25 DOM
-
2026-06-07days on market $599,900 Active 24 DOM
-
2026-06-05days on market $599,900 Active 21 DOM
-
2026-06-03days on market $599,900 Active 20 DOM
-
2026-06-03days on market $599,900 Active 19 DOM
-
2026-06-01days on market $599,900 Active 18 DOM
-
2026-05-31days on market $599,900 Active 17 DOM
-
2026-05-14$599,900 Active 1121-char remark
-
2026-05-02historical
-
2026-03-13price $649,000
-
2026-02-12price $674,000
-
2025-11-27price $679,000
-
2025-11-23price $699,000
-
2025-11-23price $709,000
-
2025-11-06$719,000 Active
-
2025-11-05historical
-
2020-05-02historical
-
2020-02-07$357,500 Active
-
2018-06-14historical
-
2018-01-15$397,500 Active
-
2017-07-17historical
-
2017-03-23$495,000
ⓘ Source: listings_history table (triggers on properties + properties_extension) + one-shot
backfill from property_details.listing_events for pre-trigger history.
Tax reassessment forecast CT · Partial reset (capped growth)
- Current annual tax
- $6,753 · $563/mo
- Projected year-2 tax
- $9,795 · $816/mo
- Expected delta
- +$3,042/yr (+$254/mo · 45.1%)
ⓘ Screening estimate from a state-policy table — verify with the county assessor before closing.
Climate risk First Street
- Flood 1/10 Low FEMA zone X (unshaded) · 0% chance over 30 yrs
- Wildfire 3/10 Moderate
- Heat 4/10 Moderate 7 d/yr ≥98°F today · 15 d/yr by 30 yrs out
- Wind 6/10 Major 27% chance of damaging wind over 30 yrs
- Air quality 4/10 Moderate 3 unhealthy d/yr today · 5 by 30 yrs out
Nearby sold comps map
Loading sold comps map…
Walkable amenities ~0.75 mi
Loading nearby amenities…
Taxation est. · year 1
- Rental income
- $59,443
- − Mortgage interest
- −$33,604
- − Property taxes
- −$6,753
- − Insurance
- −$3,000
- − Repairs & maintenance
- −$4,755
- − Management
- −$4,755
- − HOA
- −$4,380
- − Depreciation
- −$17,452
- Taxable loss
- −$15,255
- Est. tax savings @ 24.0%
- +$3,661
- After-tax cash flow
- $-1,262/yr
For passive investors: Depreciation is non-cash, so a rental often shows a tax loss while cash-flowing — sheltering income. Rental losses are passive: they offset passive income freely, and up to $25,000/yr can offset ordinary (W-2) income if you actively participate and your MAGI is under $100k (phasing out to $0 by $150k); unused losses carry forward. On sale, claimed depreciation is recaptured at up to 25%, and gains may owe capital-gains tax (a 1031 exchange can defer both). Figures are a year-1 estimate at your 24.0% rate — not tax advice; consult a CPA.
Schools (NCES district)
- District
- Danbury School District
- NCES district ID
- 0901020
- Math proficiency
- 19% ▼ -17.00%
- Reading proficiency
- 32% ▼ -16.00%
- Median HH income
- $65,793
- Composite
- 23.93/100
- National rank
- #7784
- State rank
- #131 of 153 in CT
Livability — Danbury
- Score
- 76/100
- State rank
- #51
- US rank
- #3379
Category grades
Schools grade is shown separately in the Schools card above.
Census & demographics
- Census place
- Danbury, CT
- County
- Fairfield County · 765,532 people
- City population
- 87,061
- Metro
- Bridgeport-Stamford-Norwalk, CT
- Population (ZIP)
- 55,833
- Household income
- $76,933
- Rent vs Own
- Severe rent burden
- 3255.0
Population outlook (Western Connecticut County) Hauer SSP2
- By 2040
- 685,031
Race, ethnicity, and origin ACS 2023
- Neighborhood character
- Highly diverse neighborhood (Simpson 0.72)
- Race & ethnicity
- Hispanic / Latino 37% White 35% Two or more races 19% Black 12% Asian 5%
- Hispanic origin (detail)
- Mexican 4% Puerto Rican 3% Dominican 6%
- Common ancestry
- Estonian 8% Russian 4% Romanian 3%
- Foreign-born
- 41% · Canada, Jamaica, Dominican Republic
- Languages at home
- 48% English-only · Spanish 32% Other Indo-European 16% Other Asian/Pacific 1%
Political lean MEDSL · Western Connecticut
- 2024 margin
- D (+19.1) · D 58.8% · R 39.7% · Other 1.6%
- All cycles
- 2024: D+19.1
Not yet ingested
- Civics
- —
Market trends
- HPI YoY
- ▼ -309.71%
- Current HPI
- 286.5484
- Rent YoY
- ▲ 3.08%
- Metro
- Bridgeport-Stamford-Norwalk, CT
- State GDP YoY
- ▲ 1.06%
- F500 in state
- 38
Industry mix (Fortune 500 HQ in CT)
| Industry | F500 HQs | Revenue |
|---|---|---|
| Industrial Machinery | 4 | $38B |
|
||
| Insurance | 3 | $71B |
|
||
| Financial Services | 2 | $25B |
|
||
| Transportation / Logistics | 2 | $18B |
|
||
| Healthcare | 1 | $247B |
|
||
| Telecommunications | 1 | $55B |
|
||
Price history
+21.2% since first listed15 events — show timeline
- 2026-05-14 Listed $599,900 Smart MLS
- 2026-05-02 Listing Removed — Smart MLS
- 2026-03-13 Price Changed $649,000 Smart MLS
- 2026-02-12 Price Changed $674,000 Smart MLS
- 2025-11-27 Price Changed $679,000 Smart MLS
- 2025-11-23 Price Changed $699,000 Smart MLS
- 2025-11-23 Price Changed $709,000 Smart MLS
- 2025-11-06 Listed $719,000 Smart MLS
- 2025-11-05 Coming Soon — Smart MLS
- 2020-05-02 Listing Removed — Smart MLS
- 2020-02-07 Listed $357,500 Smart MLS
- 2018-06-14 Listing Removed — Smart MLS
- 2018-01-15 Listed $397,500 Smart MLS
- 2017-07-17 Listing Removed — Smart MLS
- 2017-03-23 Listed $495,000 Smart MLS
Property tax history
+3.0%/yrLatest (2023): $6,753 · +16.3% YoY. Source: county tax records.
Cash-flow waterfall
monthlySold comps — $/sqft
last 12 mo · ≤1 miLoading sold comps…