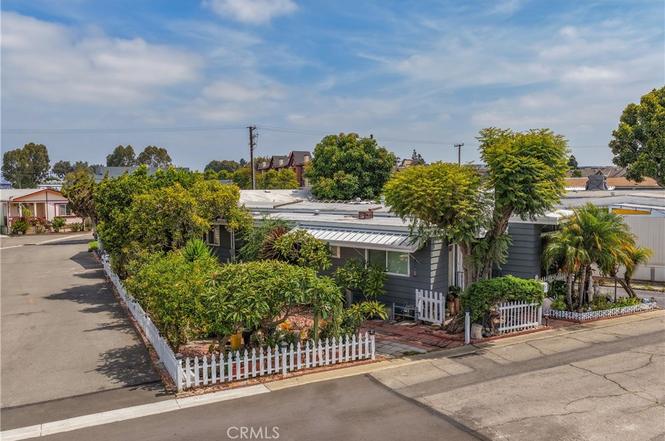
14352 Beach #73
Westminster, CA 92683
$89,000B
2 bd · 2.0 ba ·
1,140 sqft ·
Built 1966
· Manufactured
· Active
· 3 DOM
Cashflow @ list (25.0% down · 7.5%)
Estimated rent
$2,795/mo
Mortgage (P&I)
−$467
Tax + insurance
−$148
HOA
−$0
Vac / Maint / Mgmt
−$587
Net cashflow
$1,593/mo
Annual
$19,116/yr
Cap rate
27.77%
Cash-on-cash
76.71%
DSCR
4.41
1% rule
3.14%
Cash to close
$24,920
Investor read
- This is a 2-bed/2.0-bath manufactured listed at $89k.
- At list price, monthly cash flow is $2k ($19k/yr) — positive.
- The deal already cash-flows at list — no discount required.
- Meets the 1% rule at list price ($3k rent vs $89k).
- Only 3 days on market — expect competitive offers; lowballing is unlikely to land.
- Local home prices are declining (-3.0%/yr); year-one equity from $615 of loan paydown is wiped out by about $3k of value loss. Plan a longer hold.
- Location reads 62/100 on livability (#509 in CA) — a middle-class / working-renter tenant base. Strengths: commute A+; Watch: crime D-, amenities F, cost of living F.
- Huntington Beach Union High (suburban): math 65% / reading 82% proficiency, ranked #39 of 517 in CA (top 8%) — strong family-tenant draw, lease renewals of 3-5y typical.
- Market conditions: Rents rising (+2.0%/yr); 87 active listings in the ZIP; 40 comparable units currently listed for rent nearby; rentals leasing fast (median 2d on market — plan ~1-2 weeks tenant-placement turnaround); solid renter incomes; 6,974 units permitted in Orange County in 2024 (3,839 in 5+ unit buildings).
- Orange County population projected at +14% by 2050 — modest demand growth; plan on rents tracking national, not racing it.
- At projected returns (-3.0% appreciation + 2.0% rent growth), your $25k cash investment doubles in ~2 years — after that, you're playing with house money.
- Climate carrying-cost: extreme-heat days projected 7→23/yr by 2055 (HVAC capex compounding) — expect insurance premiums to compound above CPI over the hold.
- Cap rate 27.8% vs local median 2.0% in Westminster — top-decile yield for the area; either an underpriced asset or a hidden risk that comps aren't pricing in. Stress-test before assuming the spread holds.
- This rent runs 39% of the median local income ($86k/yr) — at the standard rent-burdened threshold; future hikes will face affordability resistance.
Questions for listing agent
- Built in 1966 — when were the roof, HVAC, electrical panel, plumbing, and water heater last replaced?
- Is there a deadline driving the sale (1031 exchange, divorce, estate, relocation)? That informs how much negotiation room exists.
- Crime grade is D in this area — have there been break-ins, vandalism, or insurance claims at this property in the last 3 years? What carrier currently insures it and at what premium?
- What's the average days-on-market for RENTAL listings here right now (not sales)? A rising rental-DOM trend means longer vacancies and softer asking-rent achievability than the comps imply.
- What's the recent tenant-quality profile in this submarket — average credit score on applications, eviction rate, late-payment / NSF rate, and stable-employment percentage? A property-management company in the area should have these aggregated.
- How much new for-sale + rental construction is in the pipeline within 1–3 miles? Heavy new supply typically softens prices + rents 12–24 months out; constrained supply supports both.
CashFlowRE · CFR-K3NT48134MXMJA
· Data 2 days ago
cashflowre.app · 2026-05-29