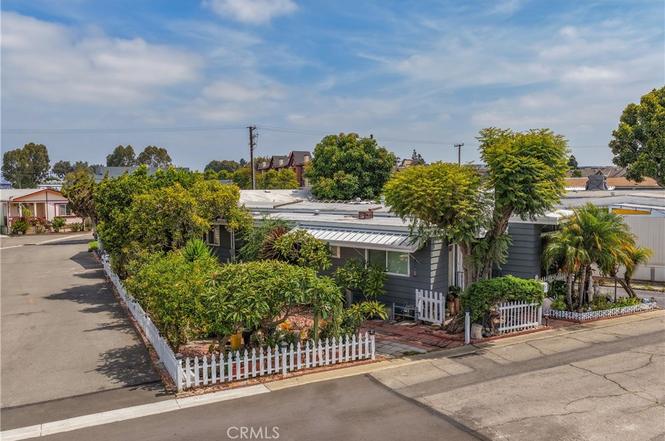
14352 Beach #73 · Westminster, CA
Flood risk 1/10 · Minimal
- FEMA flood zone
- X (shaded)
- Chance of flooding over 30 yrs
- 0.0%
- Est. flood insurance / yr
- $507 – $1,088
Fire risk 1/10 · Minimal
- Est. fire insurance / yr
- $659 – $1,223
Heat risk 5/10 · Moderate
- Hot days now (above 87°F)
- 7 days/yr
- Hot days in 30 yrs
- 23 days/yr
Wind risk 1/10 · Minimal
- Chance of severe wind over 30 yrs
- —
Air-quality risk 5/10 · Moderate
- Unhealthy air days now
- 7 days/yr
- Unhealthy air days in 30 yrs
- 8 days/yr
Risk factors via First Street. Map © Google.
Why this score? — see what drove the B grade
The composite is a weighted blend of 9 inputs, each scored 0–100. Each bar is that input's sub-score; the figure is the points it added to the 100-point composite (weight × sub-score).
- Cash flow +30.0/30.0
- 1% rule +10.0/10.0
- DSCR +10.0/10.0
- ARV discount +7.5/15.0
- Schools +6.5/10.0
- Livability +3.1/5.0
- Rent growth +3.0/5.0
- Condition / age +2.5/5.0
- Appreciation +0.0/10.0
$89,000
🖨 Deal sheet 📄 Offer letter ✓ Due diligence
Listing remarks
Welcome to Beach Boulevard Cottages, a wonderful community conveniently located just a short drive from Little Saigon, popular Vietnamese restaurants, shopping centers, Bella Terra, and with easy access to the 405 and 22 Freeways. This charming 2-bedroom, 2-bath mobile home offers a comfortable and inviting floor plan with numerous updates throughout. The kitchen features quartz countertops, a center island, cabinetry and drawers, and includes a stainless steel refrigerator. The washer and dryer are also included. Beautiful beige wood-look luxury vinyl flooring flows throughout the home, complemented by bright windows that fill the living spaces with natural light. The spacious family room
Key facts
- Quartz countertops
- Shopping centers
- Center island
Tags
Property features AI
Finance
- Other: Park name: Beach Boulevard Cottages; Directions: South of Beach Blvd, left after Westminster Blvd
- HOA & community: Located in Beach Boulevard Cottages; Street lighting; Suburban community features; Manager approval required
Exterior
- Parking: 2 covered carport spaces (attached); 2 garage spaces; Total of 4 parking spaces; Guest parking available
- Utilities: District/public water; Public sewer; Natural gas connected/available; Electricity connected/available (standard); Cable available; Telephone in street; Water connected; Sewer connected
- Home design: Single-bodied manufactured home; One story; Turnkey condition; Mobile home remains on site; 12' x 72' mobile dimensions; Access via paved city streets
- Construction: Concrete perimeter foundation; Year-built source: Other
- Exterior features: Vinyl and wood fencing; Corner lot; Community pool
Interior
- Kitchen: Gas cooktop; Gas & electric range; Refrigerator; Quartz counters; Gas water heater
- Bedrooms: All bedrooms on main level; Includes a family room
- Flooring: Laminate flooring
- Bathrooms: 2 full bathrooms; Shower
- Interior features: Quartz counters; Ceiling fan; One-level living; Front entry
- Laundry & utility: Washer included; Dryer included; Washer hookup; Gas dryer hookup; Gas & electric dryer hookup; Laundry area in kitchen
Neighborhood map
What this means for you Summary
Snapshot
- This is a 2-bed/2.0-bath manufactured listed at $89k.
Deal economics
- At list price, monthly cash flow is $2k ($19k/yr) — positive.
- The deal already cash-flows at list — no discount required.
- Meets the 1% rule at list price ($3k rent vs $89k).
- Cap rate 27.8% vs local median 2.0% in Westminster — top-decile yield for the area; either an underpriced asset or a hidden risk that comps aren't pricing in. Stress-test before assuming the spread holds.
Location & tenants
- Location reads 62/100 on livability (#509 in CA) — a middle-class / working-renter tenant base. Strengths: commute A+; Watch: crime D-, amenities F, cost of living F.
- Huntington Beach Union High (suburban): math 65% / reading 82% proficiency, ranked #39 of 517 in CA (top 8%) — strong family-tenant draw, lease renewals of 3-5y typical.
- Market conditions: Rents rising (+2.0%/yr); 87 active listings in the ZIP; 40 comparable units currently listed for rent nearby; rentals leasing fast (median 1d on market — plan ~1-2 weeks tenant-placement turnaround); solid renter incomes; 6,974 units permitted in Orange County in 2024 (3,839 in 5+ unit buildings).
- This rent runs 39% of the median local income ($86k/yr) — at the standard rent-burdened threshold; future hikes will face affordability resistance.
Forward outlook
- Local home prices are declining (-3.0%/yr); year-one equity from $615 of loan paydown is wiped out by about $3k of value loss. Plan a longer hold.
- Orange County population projected at +14% by 2050 — modest demand growth; plan on rents tracking national, not racing it.
- At projected returns (-3.0% appreciation + 2.0% rent growth), your $25k cash investment doubles in ~2 years — after that, you're playing with house money.
Negotiation context
- Only 3 days on market — expect competitive offers; lowballing is unlikely to land.
Risks & watch-outs
- Climate carrying-cost: extreme-heat days projected 7→23/yr by 2055 (HVAC capex compounding) — expect insurance premiums to compound above CPI over the hold.
Questions for the listing agent
- Built in 1966 — when were the roof, HVAC, electrical panel, plumbing, and water heater last replaced?
- Is there a deadline driving the sale (1031 exchange, divorce, estate, relocation)? That informs how much negotiation room exists.
- Crime grade is D in this area — have there been break-ins, vandalism, or insurance claims at this property in the last 3 years? What carrier currently insures it and at what premium?
- What's the average days-on-market for RENTAL listings here right now (not sales)? A rising rental-DOM trend means longer vacancies and softer asking-rent achievability than the comps imply.
- What's the recent tenant-quality profile in this submarket — average credit score on applications, eviction rate, late-payment / NSF rate, and stable-employment percentage? A property-management company in the area should have these aggregated.
- How much new for-sale + rental construction is in the pipeline within 1–3 miles? Heavy new supply typically softens prices + rents 12–24 months out; constrained supply supports both.
Investment metrics
- 1% rule
- 3.14% ✓
- Cap rate
- 27.77%
- Cash-on-cash
- 76.71%
- DSCR
- 4.41
- GRM
- 2.7
CMA / ARV
- ARV (on-the-fly)
- $180,120
- Comps found
- 10
Show comp detail 10 sales within ~0.75 mi
| Address | Dist | Beds/Ba | Sqft | Sold | Price | $/sf | Match |
|---|---|---|---|---|---|---|---|
| 14352 Beach #66 | 0.10mi | 2/2.0 | 1,080 (-5%) | 1mo | $125,000 | $116 | 86 |
| 14352 Beach Blvd #13 | 0.10mi | 3/2.0 (+1) | 1,104 (-3%) | 14mo | $174,000 | $158 | 74 |
| 14352 Beach Blvd #67 | 0.00mi | 2/2.0 | 1,038 (-9%) | 23mo | $166,000 | $160 | 66 |
| 14352 Beach Blvd #99 | 0.00mi | 2/2.0 | 1,300 (+14%) | 14mo | $140,000 | $108 | 65 |
| 14352 Beach Blvd #96 | 0.02mi | 2/2.0 | 1,000 (-12%) | 17mo | $110,000 | $110 | 65 |
| 14352 Beach Blvd #39 | 0.02mi | 2/2.0 | 1,040 (-9%) | 24mo | $76,000 | $73 | 64 |
| 14352 Beach Blvd #11 | 0.10mi | 2/1.0 | 1,000 (-12%) | 19mo | $85,000 | $85 | 55 |
| 14272 Hoover St #151 | 0.47mi | 3/2.0 (+1) | 1,120 (-2%) | 23mo | $240,000 | $214 | 51 |
| 14272 Hoover St | 0.47mi | 3/2.0 (+1) | 1,000 (-12%) | 4mo | $210,000 | $210 | 50 |
| 14272 Hoover St #141 | 0.47mi | 3/2.0 (+1) | 1,000 (-12%) | 15mo | $220,000 | $220 | 40 |
Match score weights: distance 35% · size 25% · config 20% · recency 20%. Top-matched comps best support the ARV.
Projected returns pro-forma
-3.0% appreciation · 2.01% rent growth · sell at horizon
- IRR
- 75.6%
- Equity multiple
- 4.38×
- Total profit
- $84,320
- Equity at exit
- $13,270
- IRR
- 79.0%
- Equity multiple
- 8.75×
- Total profit
- $193,147
- Equity at exit
- $7,695
Cash invested: $24,920 (down + closing). Projections, not guarantees.
Landlord ↔ Tenant lean methodology
- Overall (STATE)
- 18 Strongly Tenant-Friendly
- State California
- 18 Strongly Tenant-Friendly · D+13
- County
- — inherits STATE
- City
- — inherits STATE
ZIP-level market 92683
- Rents YoY
- 2.0%
- Active inventory
- 87
- Price-to-rent
- 2.7×
Monthly cashflow live
- Estimated rent
- $2,795 high interval (Pro) →
- Mortgage (P&I)
- −$467
- Tax est. 1.5%
- −$111 /mo · $1,335/yr
- Insurance
- −$37
- HOA
- −$0
- Vacancy / Maint / Mgmt
- −$587
- Net cashflow
- $1,593
Break-even live
UW: 25.0% down · 7.5% · 30yr · 1.5% tax · 5.0% vac · 8.0% maint · 8.0% mgmt
Financing live
Cash to close
- Down payment
- $22,250
- Closing costs
- $2,670
- Reserves months
- —
- Total cash needed
- —
Loan-product check · same deal, 3 products live
Conventional
25% down · 7.5% · 30yr
- Down + closing
- —
- Monthly P&I
- —
- Monthly cashflow
- —
- DSCR
- —
- Eligible?
- —
Personal DTI + credit; lowest rate.
DSCR
20% down · 8.5% · 30yr
- Down + closing
- —
- Monthly P&I
- —
- Monthly cashflow
- —
- DSCR
- —
- Eligible?
- —
No personal income docs; deal must DSCR.
Hard money
10% down · 12.0% · 12mo
- Down + closing
- —
- Monthly P&I
- —
- Monthly cashflow
- —
- DSCR
- —
- Eligible?
- —
Short-term bridge; refi at stabilization.
Rent comps 40 comps
| Address | Beds | Baths | Sqft | Rent | $/sqft | DOM | Units | Dist |
|---|---|---|---|---|---|---|---|---|
| 7861 14th St Unit C Westminster, CA | 2.0 | 2.0 | 925 | $2,800 | $3.03 | 1d | 1 | 0.24mi |
| 7861 14th St Westminster, CA | 2.0 | 2.0 | 1025 | $2,700 | $2.63 | 2d | 1 | 0.25mi |
| 7792 15th St Westminster, CA | 1.0 | 1.0 | 950 | $2,400 | $2.53 | 3d | 1 | 0.31mi |
| 14332 Joyce Ave Westminster, CA | 3.0 | 2.0 | 1100 | $3,890 | $3.54 | 1d | 1 | 0.38mi |
| 14322 Joyce Ave Westminster, CA | 3.0 | 2.0 | 1200 | $4,190 | $3.49 | 5d | 1 | 0.38mi |
| 7643 14th St Westminster, CA | 2.0 | 2.0 | 1002 | $3,250 | $3.24 | 1d | 1 | 0.42mi |
| 7661 Baylor Dr Westminster, CA | 1.0–2.0 | 1.0 | 787 | $2,400 | $3.05 | 1d | 2 | 0.49mi |
| 13920 Hoover St Westminster, CA | 2.0 | 1.0–2.0 | 645 | $3,031 | $4.70 | 1d | 11 | 0.65mi |
| 8631 Westminster Ave Garden Grove, CA | 1.0–2.0 | 1.0 | 660 | $2,489 | $3.77 | 1d | 9 | 0.72mi |
| 8810 Hewitt Pl #22 Garden Grove, CA | 2.0 | 2.5 | 1025 | $3,200 | $3.12 | 1d | 1 | 0.93mi |
| 7731 Trask Ave Westminster, CA | 2.0 | 1.0 | 960 | $2,595 | $2.70 | 1d | 2 | 0.98mi |
| 14051 Locust St Unit 201 Westminster, CA | 2.0 | 2.5 | 1019 | $3,127 | $3.07 | 15d | 1 | 0.98mi |
| 13891 Cedar St Westminster, CA | 2.0 | 1.5 | 1194 | $2,950 | $2.47 | 1d | 1 | 1.00mi |
| 7012 Main St Westminster, CA | 1.0–2.0 | 1.0 | 812 | $2,395 | $2.95 | 11d | 5 | 1.01mi |
| 13781 Cherry St Westminster, CA | 2.0 | 1.0 | 1000 | $2,300 | $2.30 | 1d | 1 | 1.02mi |
| 13781 Cherry St Unit 2 Westminster, CA | 2.0 | 1.0 | 1000 | $2,300 | $2.30 | 17d | 1 | 1.02mi |
| 7012 Main St Unit 7042-11 Westminster, CA | 2.0 | 1.0 | 900 | $2,395 | $2.66 | 1d | 1 | 1.02mi |
| 7012 Main St Unit 7022-16 Westminster, CA | 2.0 | 1.0 | 900 | $2,395 | $2.66 | 7d | 1 | 1.02mi |
| 7012 Main St Unit 7042-04 Westminster, CA | 1.0 | 1.0 | 725 | $1,995 | $2.75 | 1d | 1 | 1.02mi |
| 7012 Main St Unit 7042-06 Westminster, CA | 2.0 | 1.0 | 900 | $2,395 | $2.66 | 17d | 1 | 1.02mi |
| 7012 Main St Unit 7032-02 Westminster, CA | 1.0 | 1.0 | 725 | $1,995 | $2.75 | 7d | 1 | 1.02mi |
| 13872 Locust St Westminster, CA | 2.0 | 1.0 | 1194 | $2,950 | $2.47 | 3d | 1 | 1.03mi |
| 13751 Cherry St Unit 3 Westminster, CA | 2.0 | 1.0 | 800 | $2,325 | $2.91 | 1d | 1 | 1.03mi |
| 13751 Cherry St Unit 4 Westminster, CA | 2.0 | 1.0 | 700 | $2,395 | $3.42 | 1d | 1 | 1.03mi |
| 13751 Cherry St Unit 6 Westminster, CA | 2.0 | 1.0 | 700 | $2,495 | $3.56 | 1d | 1 | 1.03mi |
| 14452 Goldenwest St Westminster, CA | 2.0 | 1.5 | 1300 | $3,098 | $2.38 | 1d | 1 | 1.03mi |
| 8520 Gloria Ave Garden Grove, CA | 1.0–2.0 | 1.0 | 762 | $2,450 | $3.21 | 1d | 4 | 1.03mi |
| 8842 Enloe Ave Garden Grove, CA | 3.0 | 2.0 | 1300 | $3,950 | $3.04 | 1d | 1 | 1.07mi |
| 13782 Locust St Westminster, CA | 2.0 | 1.0 | 917 | $2,765 | $3.02 | 1d | 2 | 1.07mi |
| 7152 Fenway Dr Westminster, CA | 1.0 | 1.0 | 766 | $2,250 | $2.94 | 24d | 1 | 1.13mi |
| 13171 Monroe St Garden Grove, CA | 2.0 | 2.0 | 988 | $2,795 | $2.83 | 1d | 1 | 1.20mi |
| 7211 Trask Ave Unit 7211-A Westminster, CA | 2.0 | 1.5 | 1100 | $2,595 | $2.36 | 1d | 1 | 1.21mi |
| 8172 Larson Ave Garden Grove, CA | 3.0 | 2.5 | 1233 | $3,450 | $2.80 | 1d | 1 | 1.22mi |
| 8041 Worthy Dr Westminster, CA | 2.0 | 1.0 | 900 | $2,700 | $3.00 | 1d | 1 | 1.26mi |
| 13292 Yockey St Unit 23 Garden Grove, CA | 1.0 | 1.0 | 750 | $1,995 | $2.66 | 17d | 1 | 1.30mi |
| 13051 Monroe St Unit C Garden Grove, CA | 2.0 | 2.0 | 1100 | $2,700 | $2.45 | 1d | 1 | 1.32mi |
| 15200 Magnolia St Westminster, CA | 1.0–2.0 | 1.0 | 762 | $2,675 | $3.51 | 2d | 2 | 1.33mi |
| 14523 Ontario Dr Westminster, CA | 2.0 | 2.0 | 750 | $2,600 | $3.47 | 43d | 1 | 1.35mi |
| 13057 Kiwi Ln Garden Grove, CA | 3.0 | 2.5 | 1261 | $3,500 | $2.78 | 1d | 1 | 1.36mi |
| 13392 Magnolia St Unit 13392-C Garden Grove, CA | 2.0 | 2.0 | 1129 | $2,595 | $2.30 | 22d | 1 | 1.37mi |
Listing history 4 events
-
2026-06-18days on market $89,000 Active 3 DOM
-
2026-06-17days on market $89,000 Active 2 DOM
-
2026-06-16remarks 699-char remark
-
2026-06-16$89,000 Active 1 DOM
ⓘ Source: listings_history table (triggers on properties + properties_extension) + one-shot
backfill from property_details.listing_events for pre-trigger history.
Climate risk First Street
- Flood 1/10 Low FEMA zone X (shaded) · 0% chance over 30 yrs
- Wildfire 1/10 Low
- Heat 5/10 Major 7 d/yr ≥87°F today · 23 d/yr by 30 yrs out
- Wind 1/10 Low
- Air quality 5/10 Major 7 unhealthy d/yr today · 8 by 30 yrs out
Nearby sold comps map
Loading sold comps map…
Walkable amenities ~0.75 mi
Loading nearby amenities…
Taxation est. · year 1
- Rental income
- $33,540
- − Mortgage interest
- −$4,985
- − Property taxes
- −$1,335
- − Insurance
- −$445
- − Repairs & maintenance
- −$2,683
- − Management
- −$2,683
- − Depreciation
- −$2,589
- Taxable income
- $18,819
- Est. tax owed @ 24.0%
- −$4,516
- After-tax cash flow
- $14,599/yr
For passive investors: Depreciation is non-cash, so a rental often shows a tax loss while cash-flowing — sheltering income. Rental losses are passive: they offset passive income freely, and up to $25,000/yr can offset ordinary (W-2) income if you actively participate and your MAGI is under $100k (phasing out to $0 by $150k); unused losses carry forward. On sale, claimed depreciation is recaptured at up to 25%, and gains may owe capital-gains tax (a 1031 exchange can defer both). Figures are a year-1 estimate at your 24.0% rate — not tax advice; consult a CPA.
Schools (NCES district)
- District
- Huntington Beach Union High
- NCES district ID
- 0618060
- Math proficiency
- 65% ▲ 17.00%
- Reading proficiency
- 82% ▲ 8.00%
- Median HH income
- $78,159
- Composite
- 64.9/100
- National rank
- #511
- State rank
- #39 of 517 in CA
Livability — Westminster
- Score
- 62/100
- State rank
- #509
- US rank
- #17242
Category grades
Schools grade is shown separately in the Schools card above.
Census & demographics
- Census place
- Westminster, CA
- County
- Orange County · 3,096,323 people
- City population
- 89,833
- Metro
- Los Angeles-Long Beach-Anaheim, CA
- Population (ZIP)
- 89,833
- Household income
- $85,585
- Rent vs Own
- Severe rent burden
- 4639.0
Population outlook (Orange County) Hauer SSP2
- Today (2025)
- 3,477,456 people
- By 2030
- 3,613,117 · +3.9%
- By 2040
- 3,835,945 · +10.3%
- By 2050
- 3,968,736 · +14.1%
- By 2075
- 4,097,053 · +17.8%
- By 2100
- 3,903,633 · +12.3%
Race, ethnicity, and origin ACS 2023
- Neighborhood character
- Diverse neighborhood (Simpson 0.64)
- Race & ethnicity
- Asian 51% Hispanic / Latino 24% White 20% Two or more races 9%
- Hispanic origin (detail)
- Mexican 20%
- Common ancestry
- Slovak 1% Portuguese 1% Lithuanian 1%
- Foreign-born
- 46% · Vietnam, Canada, China
- Languages at home
- 35% English-only · Vietnamese 40% Spanish 18% Chinese 2%
Political lean MEDSL · Orange
- 2024 margin
- Toss-up / Even · D 49.7% · R 47.1% · Other 3.2%
- 2008→2024 swing
- +5.2pp toward D · 2008: -2.6pp · 2024: 2.6pp
- All cycles
- 2024: D+2.6 2020: D+9.0 2016: D+7.7 2012: R+8.3 2008: R+2.6
Not yet ingested
- Civics
- —
Market trends
- HPI YoY
- ▼ -917.95%
- Current HPI
- 410.3463
- Rent YoY
- ▲ 2.01%
- Metro
- Los Angeles-Long Beach-Anaheim, CA
- State GDP YoY
- ▲ 3.21%
- F500 in state
- 116
Industry mix (Fortune 500 HQ in CA)
| Industry | F500 HQs | Revenue |
|---|---|---|
| Technology | 27 | $1,492B |
|
||
| Financial Services | 3 | $174B |
|
||
| Retail | 3 | $44B |
|
||
| Insurance | 3 | $26B |
|
||
| Media / Entertainment | 2 | $115B |
|
||
| Pharmaceuticals / Biotech | 2 | $62B |
|
||
Price history
1 event — show timeline
- 2026-06-15 Listed $89,000 CRMLS
Cash-flow waterfall
monthlySold comps — $/sqft
last 12 mo · ≤1 miLoading sold comps…