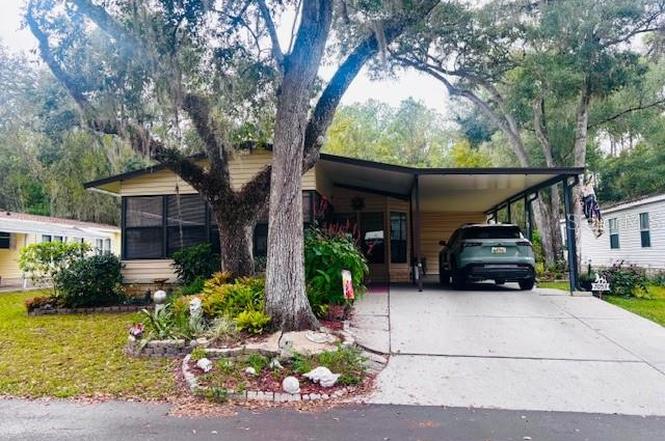
7053 Spanish Moss Ln
Hill 'n Dale, FL 34601
$145,000C+
3 bd · 2.0 ba ·
1,521 sqft ·
Built 1990
· Condo
· Active
· 206 DOM
Cashflow @ list (25.0% down · 7.5%)
Estimated rent
$1,950/mo
Mortgage (P&I)
−$760
Tax + insurance
−$591
HOA
−$275
Vac / Maint / Mgmt
−$409
Net cashflow
$-86/mo
Annual
$-1,030/yr
Cap rate
9.11%
Cash-on-cash
10.07%
DSCR
1.45
1% rule
1.34%
Cash to close
$40,600
Investor read
- This is a 3-bed/2.0-bath condo listed at $145k.
- At list price, monthly cash flow is $-86 ($-1k/yr) — negative.
- To cash-flow at today's rent, offer at most $130k (10.5% below list).
- Meets the 1% rule at list price ($2k rent vs $145k).
- It's been on market 206 days — a 12% lower offer ($128k) is reasonable based on typical stale-listing flexibility.
- Recommended offer: $128k (12.0% below list) — sets the bar for market timing.
- Local home prices are declining (-3.0%/yr); year-one equity from $1k of loan paydown is wiped out by about $4k of value loss. Plan a longer hold.
- Location reads: area grade C — affects rentability + tenant quality, not the cash-flow math above.
- Hernando (suburban): math 50% / reading 50% proficiency, ranked #38 of 73 in FL (top 52%) — acceptable for families but not a draw, mixed tenant base, ~2y average lease.
- Watch-outs: flood insurance adds $427/mo.
- Market conditions: Rents flat; 492 active listings in the ZIP; 3 comparable units currently listed for rent nearby; rentals at typical pace (median 22d on market — plan ~3-4 weeks tenant-placement turnaround); 2,505 units permitted in Hernando County in 2024 (318 in 5+ unit buildings).
- Hernando County population projected at +11% by 2050 — modest demand growth; plan on rents tracking national, not racing it.
- 3 sale attempts with the ask held roughly flat each time — persistent listings suggest the price (not the market) is what's stuck; bring a comps-based counter.
- Climate carrying-cost: in FEMA flood zone AE (mandatory federal flood insurance); severe wind risk, 99% chance of damaging wind over 30y; major wildfire risk; extreme-heat days projected 7→24/yr by 2055 (HVAC capex compounding) — expect insurance premiums to compound above CPI over the hold.
- Cap rate 9.1% vs local median 5.4% in Hill 'n Dale — top-decile yield for the area; either an underpriced asset or a hidden risk that comps aren't pricing in. Stress-test before assuming the spread holds.
- This rent runs 39% of the median local income ($60k/yr) — at the standard rent-burdened threshold; future hikes will face affordability resistance.
Questions for listing agent
- What do current leases actually rent for vs. the listed asking? Can we see a recent rent roll and the last 12 months of T-12 income?
- It's been on market 206 days. Have you received any prior offers? Is the seller open to a 12% concession, seller financing, or rate buy-down credit?
- What's the actual annual flood-insurance premium (NFIP or private), and is the property in a SFHA with mandatory coverage?
- What does the HOA fee cover, when was the last increase, and are there any pending special assessments or reserve-fund shortfalls?
- Any open or pending special assessments — roof, HVAC, plumbing, elevator, façade? What's the per-unit balance and payoff schedule, and is the seller paying it off at close or rolling it to the buyer?
- Why hasn't it sold? Are there any deal-killer items the seller is aware of (foundation, flood, title, zoning, code violations)?
- Is there a deadline driving the sale (1031 exchange, divorce, estate, relocation)? That informs how much negotiation room exists.
- What's the average days-on-market for RENTAL listings here right now (not sales)? A rising rental-DOM trend means longer vacancies and softer asking-rent achievability than the comps imply.
CashFlowRE · CFR-K5GAE102NFPAEA
· Data 2 days ago
cashflowre.app · 2026-05-29