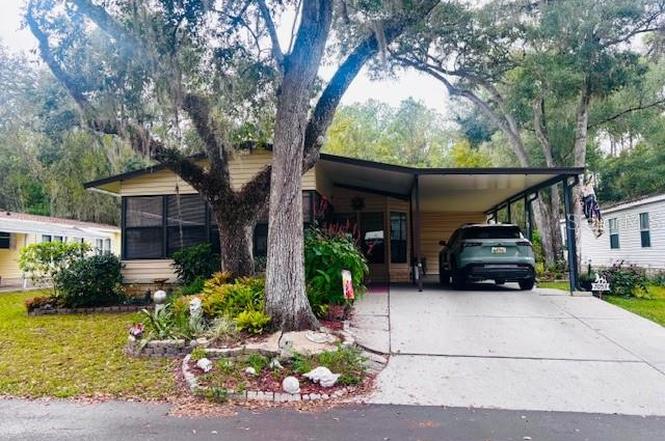
7053 Spanish Moss Ln · Hill 'n Dale, FL
Flood risk 5/10 · Moderate
- FEMA flood zone
- AE
- Chance of flooding over 30 yrs
- 0.24%
- Est. flood insurance / yr
- $1,737 – $8,500
Fire risk 6/10 · Moderate
- Est. fire insurance / yr
- $947 – $1,759
Heat risk 9/10 · Severe
- Hot days now (above 109°F)
- 7 days/yr
- Hot days in 30 yrs
- 24 days/yr
Wind risk 9/10 · Severe
- Chance of severe wind over 30 yrs
- 99.0%
Air-quality risk 1/10 · Minimal
- Unhealthy air days now
- 0 days/yr
- Unhealthy air days in 30 yrs
- 0 days/yr
Risk factors via First Street. Map © Google.
Why this score? — see what drove the C+ grade
The composite is a weighted blend of 9 inputs, each scored 0–100. Each bar is that input's sub-score; the figure is the points it added to the 100-point composite (weight × sub-score).
- Cash flow +25.6/30.0
- DSCR +8.5/10.0
- 1% rule +8.4/10.0
- ARV discount +7.5/15.0
- Schools +4.2/10.0
- Rent growth +2.5/5.0
- Livability +2.5/5.0
- Condition / age +2.5/5.0
- Appreciation +0.0/10.0
$145,000
🖨 Deal sheet 📄 Offer letter ✓ Due diligence
Listing remarks
BRAND NEW ROOF !! This FANTASTIC 2 Bedroom, 2 Bath Palm Harbor Manufactured Home Has Wood Flooring in the Living Room, Dining Room, Kitchen, and Dinette Area. The Kitchen Has Tons of Cabinets & Counter Space Complete W/ 2 Pantry's, Breakfast Bar, and Office Area. The Primary Bedroom is HUGE W/ En Suite Bathroom, Garden Tub, Separate Shower and Built in Cabinets. Upgrades Include New Roof W/ New Skylights, 2024 Appliances and New Laminate Flooring in Bedrooms, 2024 Gutters and Vapor Barrier. 1 Car Garage W/ Workshop, Front Enclosed 4 Season Porch and a HUGE Rear 4 Season Sunroom W/ Hot Tub Overlooking The Spacious Back Yard. LOW HOA INCLUDES WATER, SEWER, GARBAGE, CABLE, INTERNET, AND
Key facts
- Wood flooring
- 4 person hot tub
- Tons of cabinets
Tags
Property features AI
Finance
- Other: Property type: Residential; Property subtype: Manufactured Home; Double wide body type; Zoning: AE; Lot about 0.18 acres (level, landscaped); Living area and building area reported from public records
- Financial info: Total annual fees: $3,300; Total monthly fees: $275; Lease restrictions apply
- HOA & community: Has HOA (association name: sherry); HOA amenities include cable TV, clubhouse, maintenance, pool, shuffleboard court; HOA fees cover cable TV, internet, grounds maintenance, pool, recreational facilities, sewer, trash, water; Monthly additional maintenance amount: $275; Association approval required; Senior community; Street lights; Pets allowed (cats and dogs)
Exterior
- Parking: Attached garage (1 car, 30x10); Carport (2 spaces)
- Utilities: Private water; Private sewer; Cable available; Electricity connected; Sewer connected; Water connected
- Home design: Manufactured double-wide home; Single-story; Faces east
- Construction: Metal frame with vinyl siding; Metal roof; Built on slab foundation
- Exterior features: Enclosed patio/porch; Front porch; Rear porch; Screened porch; Workshop; Storage; Mature landscaping with trees; Near golf course; Paved access
Interior
- Kitchen: Dishwasher; Range; Microwave; Refrigerator; Electric water heater
- Bedrooms: 2 bedrooms
- Flooring: Laminate; Wood
- Bathrooms: 2 full bathrooms
- Heating & cooling: Central heating (electric); Central air conditioning
- Interior features: Ceiling fans; Eat-in kitchen; Window treatments; Storage
- Laundry & utility: Washer; Dryer; Laundry area in garage
Neighborhood map
What this means for you Summary
Snapshot
- This is a 3-bed/2.0-bath condo listed at $145k.
Deal economics
- At list price, monthly cash flow is $-86 ($-1k/yr) — negative.
- To cash-flow at today's rent, offer at most $130k (10.5% below list).
- Meets the 1% rule at list price ($2k rent vs $145k).
- Recommended offer: $128k (12.0% below list) — sets the bar for market timing.
- Cap rate 9.1% vs local median 5.4% in Hill 'n Dale — top-decile yield for the area; either an underpriced asset or a hidden risk that comps aren't pricing in. Stress-test before assuming the spread holds.
Location & tenants
- Location reads: area grade C — affects rentability + tenant quality, not the cash-flow math above.
- Hernando (suburban): math 50% / reading 50% proficiency, ranked #38 of 73 in FL (top 52%) — acceptable for families but not a draw, mixed tenant base, ~2y average lease.
- Market conditions: Rents flat; 492 active listings in the ZIP; 3 comparable units currently listed for rent nearby; rentals at typical pace (median 22d on market — plan ~3-4 weeks tenant-placement turnaround); 2,505 units permitted in Hernando County in 2024 (318 in 5+ unit buildings).
- This rent runs 39% of the median local income ($60k/yr) — at the standard rent-burdened threshold; future hikes will face affordability resistance.
Forward outlook
- Local home prices are declining (-3.0%/yr); year-one equity from $1k of loan paydown is wiped out by about $4k of value loss. Plan a longer hold.
- Hernando County population projected at +11% by 2050 — modest demand growth; plan on rents tracking national, not racing it.
Negotiation context
- It's been on market 206 days — a 12% lower offer ($128k) is reasonable based on typical stale-listing flexibility.
- 3 sale attempts with the ask held roughly flat each time — persistent listings suggest the price (not the market) is what's stuck; bring a comps-based counter.
Risks & watch-outs
- Watch-outs: flood insurance adds $427/mo.
- Climate carrying-cost: in FEMA flood zone AE (mandatory federal flood insurance); severe wind risk, 99% chance of damaging wind over 30y; major wildfire risk; extreme-heat days projected 7→24/yr by 2055 (HVAC capex compounding) — expect insurance premiums to compound above CPI over the hold.
Questions for the listing agent
- What do current leases actually rent for vs. the listed asking? Can we see a recent rent roll and the last 12 months of T-12 income?
- It's been on market 206 days. Have you received any prior offers? Is the seller open to a 12% concession, seller financing, or rate buy-down credit?
- What's the actual annual flood-insurance premium (NFIP or private), and is the property in a SFHA with mandatory coverage?
- What does the HOA fee cover, when was the last increase, and are there any pending special assessments or reserve-fund shortfalls?
- Any open or pending special assessments — roof, HVAC, plumbing, elevator, façade? What's the per-unit balance and payoff schedule, and is the seller paying it off at close or rolling it to the buyer?
- Why hasn't it sold? Are there any deal-killer items the seller is aware of (foundation, flood, title, zoning, code violations)?
- Is there a deadline driving the sale (1031 exchange, divorce, estate, relocation)? That informs how much negotiation room exists.
- What's the average days-on-market for RENTAL listings here right now (not sales)? A rising rental-DOM trend means longer vacancies and softer asking-rent achievability than the comps imply.
- What's the recent tenant-quality profile in this submarket — average credit score on applications, eviction rate, late-payment / NSF rate, and stable-employment percentage? A property-management company in the area should have these aggregated.
- How much new apartment / multifamily construction is in the pipeline within 1–3 miles? Heavy new supply (>2% of stock underway) typically softens rents 12–24 months out; light construction supports rent growth.
Investment metrics
- 1% rule
- 1.34% ✓
- Cap rate
- 9.11%
- Cash-on-cash
- 10.07%
- DSCR
- 1.45
- GRM
- 6.2
CMA / ARV
No comps found within radius.
Projected returns pro-forma
-3.0% appreciation · 0.19% rent growth · sell at horizon
- IRR
- -25.6%
- Equity multiple
- 0.16×
- Total profit
- $-33,915
- Equity at exit
- $21,620
- IRR
- -49.7%
- Equity multiple
- -0.37×
- Total profit
- $-55,699
- Equity at exit
- $12,537
Cash invested: $40,600 (down + closing). Projections, not guarantees.
Landlord ↔ Tenant lean methodology
- Overall (STATE)
- 87 Strongly Landlord-Friendly
- State Florida
- 87 Strongly Landlord-Friendly · R+3
- County
- — inherits STATE
- City
- — inherits STATE
ZIP-level market 34601
- Home prices YoY
- -29.7%
- Rents YoY
- 0.2%
- Active inventory
- 492
- Price-to-rent
- 6.2×
Monthly cashflow live
- Estimated rent
- $1,950 medium interval (Pro) →
- Mortgage (P&I)
- −$760
- Tax from tax record
- −$104 /mo · $1,248/yr
- Insurance
- −$60
- Flood insurance flood zone
- −$427 /mo · $5,118/yr
- HOA
- −$275
- Vacancy / Maint / Mgmt
- −$409
- Net cashflow
- $-86
Break-even live
UW: 25.0% down · 7.5% · 30yr · 1.5% tax · 5.0% vac · 8.0% maint · 8.0% mgmt
Financing live
Cash to close
- Down payment
- $36,250
- Closing costs
- $4,350
- Reserves months
- —
- Total cash needed
- —
Loan-product check · same deal, 3 products live
Conventional
25% down · 7.5% · 30yr
- Down + closing
- —
- Monthly P&I
- —
- Monthly cashflow
- —
- DSCR
- —
- Eligible?
- —
Personal DTI + credit; lowest rate.
DSCR
20% down · 8.5% · 30yr
- Down + closing
- —
- Monthly P&I
- —
- Monthly cashflow
- —
- DSCR
- —
- Eligible?
- —
No personal income docs; deal must DSCR.
Hard money
10% down · 12.0% · 12mo
- Down + closing
- —
- Monthly P&I
- —
- Monthly cashflow
- —
- DSCR
- —
- Eligible?
- —
Short-term bridge; refi at stabilization.
Rent comps 3 comps
| Address | Beds | Baths | Sqft | Rent | $/sqft | DOM | Units | Dist |
|---|---|---|---|---|---|---|---|---|
| 7086 Hilton Dr Brooksville, FL | 3.0 | 2.0 | 1493 | $2,100 | $1.41 | 24d | 1 | 0.42mi |
| 7040 Hilton Dr Brooksville, FL | 3.0 | 2.0 | 1387 | $2,100 | $1.51 | 21d | 1 | 0.43mi |
| 7034 Hilton Dr Brooksville, FL | 3.0 | 2.0 | 1387 | $2,100 | $1.51 | 21d | 1 | 0.43mi |
HOA detail condo
- Monthly dues
- $275 · $3,300/yr
- Likely covers
- watersewertrashinternetcable
- Assessments
- None detected in remarks — confirm with the listing agent.
Listing history 20 events
-
2026-06-18days on market $145,000 Active 206 DOM
-
2026-06-17days on market $145,000 Active 205 DOM
-
2026-06-16days on market $145,000 Active 204 DOM
-
2026-06-15days on market $145,000 Active 203 DOM
-
2026-06-13days on market $145,000 Active 201 DOM
-
2026-06-13days on market $145,000 Active 200 DOM
-
2026-06-09days on market $145,000 Active 197 DOM
-
2026-06-08days on market $145,000 Active 196 DOM
-
2026-06-07days on market $145,000 Active 195 DOM
-
2026-06-04days on market $145,000 Active 192 DOM
-
2026-06-03days on market $145,000 Active 191 DOM
-
2026-06-02days on market $145,000 Active 190 DOM
-
2026-06-01days on market $145,000 Active 189 DOM
-
2026-05-31days on market $145,000 Active 188 DOM
-
2026-05-16status Active
-
2026-05-06historical
-
2026-02-26status Active
-
2026-02-20status Pending
-
2026-01-10price $145,000
-
2025-11-07$147,900 Active
ⓘ Source: listings_history table (triggers on properties + properties_extension) + one-shot
backfill from property_details.listing_events for pre-trigger history.
Tax reassessment forecast FL · Resets to sale price
- Current annual tax
- $1,248 · $104/mo
- Projected year-2 tax
- $1,248 · $104/mo
- Expected delta
- $0/yr ($0/mo · 0.0%)
ⓘ Screening estimate from a state-policy table — verify with the county assessor before closing.
Climate risk First Street
- Flood 5/10 Major FEMA zone AE · 24% chance over 30 yrs
- Wildfire 6/10 Major
- Heat 9/10 Extreme 7 d/yr ≥109°F today · 24 d/yr by 30 yrs out
- Wind 9/10 Extreme 99% chance of damaging wind over 30 yrs
- Air quality 1/10 Low 0 unhealthy d/yr today · 0 by 30 yrs out
Nearby sold comps map
Loading sold comps map…
Walkable amenities ~0.75 mi
Loading nearby amenities…
Taxation est. · year 1
- Rental income
- $23,399
- − Mortgage interest
- −$8,122
- − Property taxes
- −$1,248
- − Insurance
- −$5,844
- − Repairs & maintenance
- −$1,872
- − Management
- −$1,872
- − HOA
- −$3,300
- − Depreciation
- −$4,218
- Taxable loss
- −$3,076
- Est. tax savings @ 24.0%
- +$738
- After-tax cash flow
- $-292/yr
For passive investors: Depreciation is non-cash, so a rental often shows a tax loss while cash-flowing — sheltering income. Rental losses are passive: they offset passive income freely, and up to $25,000/yr can offset ordinary (W-2) income if you actively participate and your MAGI is under $100k (phasing out to $0 by $150k); unused losses carry forward. On sale, claimed depreciation is recaptured at up to 25%, and gains may owe capital-gains tax (a 1031 exchange can defer both). Figures are a year-1 estimate at your 24.0% rate — not tax advice; consult a CPA.
Schools (NCES district)
- District
- Hernando
- NCES district ID
- 1200810
- Math proficiency
- 50% ▼ -8.00%
- Reading proficiency
- 50% ▼ -4.00%
- Median HH income
- $41,985
- Composite
- 42.03/100
- National rank
- #3329
- State rank
- #38 of 73 in FL
Livability — Hill 'n Dale
No livability data for this city. (Only ~50 U.S. cities are tracked.)
Census & demographics
- County
- Hernando County · 169,677 people
- Metro
- Tampa-St. Petersburg-Clearwater, FL
- Population (ZIP)
- 24,115
- Household income
- $60,440
- Rent vs Own
- Severe rent burden
- 664.0
Population outlook (Hernando County) Hauer SSP2
- Today (2025)
- 189,218 people
- By 2030
- 194,367 · +2.7%
- By 2040
- 203,398 · +7.5%
- By 2050
- 209,589 · +10.8%
- By 2075
- 218,452 · +15.4%
- By 2100
- 205,923 · +8.8%
Race, ethnicity, and origin ACS 2023
- Neighborhood character
- Predominantly White (77%)
- Race & ethnicity
- White 77% Hispanic / Latino 11% Black 8% Two or more races 5%
- Hispanic origin (detail)
- Puerto Rican 4% Cuban 2% Dominican 1%
- Common ancestry
- Slovak 4% Romanian 2% Iranian 2%
- Foreign-born
- 4% · Canada, Jamaica
- Languages at home
- 93% English-only · Spanish 6%
Political lean MEDSL · Hernando
- 2024 margin
- Solid R (+37.0) · D 31.1% · R 68.2%
- 2008→2024 swing
- -33.5pp toward R · 2008: -3.6pp · 2024: -37.0pp
- All cycles
- 2024: R+37.0 2020: R+30.2 2016: R+29.0 2012: R+8.5 2008: R+3.6
Not yet ingested
- Civics
- —
Market trends
- HPI YoY
- ▼ -132.68%
- Current HPI
- 313.4695
- Rent YoY
- ▲ 0.19%
- Metro
- Tampa-St. Petersburg-Clearwater, FL
- State GDP YoY
- ▲ 3.28%
- F500 in state
- 36
Industry mix (Fortune 500 HQ in FL)
| Industry | F500 HQs | Revenue |
|---|---|---|
| Industrial Technology | 2 | $29B |
|
||
| Insurance | 2 | $17B |
|
||
| Retail | 1 | $60B |
|
||
| Technology Distribution | 1 | $58B |
|
||
| Homebuilding | 1 | $35B |
|
||
| Technology Manufacturing | 1 | $35B |
|
||
Price history
-2.0% since first listed6 events — show timeline
- 2026-05-16 Relisted — Stellar MLS as Distributed by MLS Grid
- 2026-05-06 Listing Removed — Stellar MLS as Distributed by MLS Grid
- 2026-02-26 Relisted — Stellar MLS as Distributed by MLS Grid
- 2026-02-20 Pending — Stellar MLS as Distributed by MLS Grid
- 2026-01-10 Price Changed $145,000 Stellar MLS as Distributed by MLS Grid
- 2025-11-07 Listed $147,900 Stellar MLS as Distributed by MLS Grid
Property tax history
+7.8%/yrLatest (2025): $1,248 · +45.6% YoY. Source: county tax records.
Cash-flow waterfall
monthlySold comps — $/sqft
last 12 mo · ≤1 miLoading sold comps…