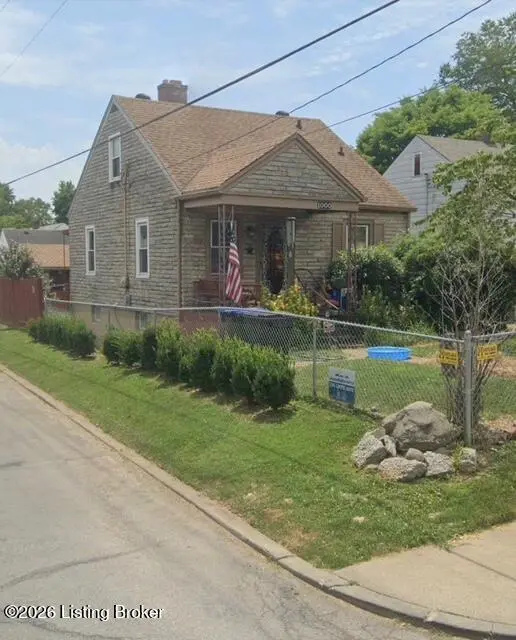
1000 Berry Blvd
Louisville, KY 40215
$1D
2 bd · 1.0 ba ·
1,623 sqft ·
Built 1940
· SingleFamily
· Pending
· 14 DOM
Cashflow @ list (25.0% down · 7.5%)
Estimated rent
$1,485/mo
Mortgage (P&I)
−$0
Tax + insurance
−$0
HOA
−$0
Vac / Maint / Mgmt
−$312
Net cashflow
$1,173/mo
Annual
$14,081/yr
Cap rate
1408081.36%
Cash-on-cash
5028839.53%
DSCR
223756.06
1% rule
148532.00%
Cash to close
$0
Investor read
- This is a 2-bed/1.0-bath single-family listed at $1.
- At list price, monthly cash flow is $1k ($14k/yr) — positive.
- The deal already cash-flows at list — no discount required.
- Meets the 1% rule at list price ($1k rent vs $1).
- Only 14 days on market — expect competitive offers; lowballing is unlikely to land.
- Local home prices are declining (-3.0%/yr); year-one equity from $0 of loan paydown is wiped out by about $0 of value loss. Plan a longer hold.
- Location reads 63/100 on livability (#333 in KY) — a middle-class / working-renter tenant base. Strengths: cost of living A+, housing A+; Watch: employment C-, health & safety D+, crime F.
- Jefferson County (urban): math 19% / reading 35% proficiency, ranked #121 of 165 in KY (top 73%) — low school quality limits family demand, transient renter base, plan for 1-2y turnover.
- Zoned schools: Semple Elementary (math 2% / reading 12%, grade F, #662 of 676 statewide, top 99%, 574 students, 79% FRL); Frederick Law Olmsted Academy North (math 5% / reading 15%, grade F, #217 of 217 statewide, top 100%, 510 students, 74% FRL); Iroquois High (math 12% / reading 8%, grade F, #245 of 254 statewide, top 97%, 1,090 students, 74% FRL) — zoned schools average 76% FRL vs 56% district-wide (20 pts higher); higher-poverty schools than district average — tighter screening recommended.
- Zoned-school proficiency averages 9% at this address vs 27% district-wide (-18 pts) — the specific schools serving this property underperform the Jefferson County average; the district grade overstates school quality for this exact location.
- Watch-outs: built in 1940 — expect roof / HVAC / electrical / plumbing capex.
- Market conditions: Rents rising fast (+5.2%/yr); 118 active listings in the ZIP; 22 comparable units currently listed for rent nearby; rentals at typical pace (median 18d on market — plan ~3-4 weeks tenant-placement turnaround); lower-income renter base — watch delinquency; 2,836 units permitted in Jefferson County in 2024 (1,558 in 5+ unit buildings).
- Jefferson County population projected at +13% by 2050 — modest demand growth; plan on rents tracking national, not racing it.
- 3 sale attempts since 14y ago with the ask held roughly flat each time — persistent listings suggest the price (not the market) is what's stuck; bring a comps-based counter.
- At projected returns (-3.0% appreciation + 5.2% rent growth), your $0 cash investment doubles in ~1 year — after that, you're playing with house money.
- Climate carrying-cost: moderate flood risk; extreme-heat days projected 7→20/yr by 2055 (HVAC capex compounding) — expect insurance premiums to compound above CPI over the hold.
- Cap rate 1408081.4% vs local median 5.0% in Louisville — top-decile yield for the area; either an underpriced asset or a hidden risk that comps aren't pricing in. Stress-test before assuming the spread holds.
- This rent runs 41% of the median local income ($44k/yr) — at the standard rent-burdened threshold; future hikes will face affordability resistance.
Questions for listing agent
- Built in 1940 — when were the roof, HVAC, electrical panel, plumbing, and water heater last replaced?
- Is there a deadline driving the sale (1031 exchange, divorce, estate, relocation)? That informs how much negotiation room exists.
- Schools are D-rated, which usually means shorter tenancies and higher turnover. Who's the typical renter profile here, and what's been the actual vacancy rate?
- Crime grade is F in this area — have there been break-ins, vandalism, or insurance claims at this property in the last 3 years? What carrier currently insures it and at what premium?
- The area grade is low — what's the realistic commute time and amenity access for the typical tenant pool here? Any planned neighborhood developments (good or bad) we should know about?
- What's the average days-on-market for RENTAL listings here right now (not sales)? A rising rental-DOM trend means longer vacancies and softer asking-rent achievability than the comps imply.
- What's the recent tenant-quality profile in this submarket — average credit score on applications, eviction rate, late-payment / NSF rate, and stable-employment percentage? A property-management company in the area should have these aggregated.
- How much new for-sale + rental construction is in the pipeline within 1–3 miles? Heavy new supply typically softens prices + rents 12–24 months out; constrained supply supports both.
CashFlowRE · CFR-K6803MDVH25GBK
· Data 4 weeks ago
cashflowre.app · 2026-05-29