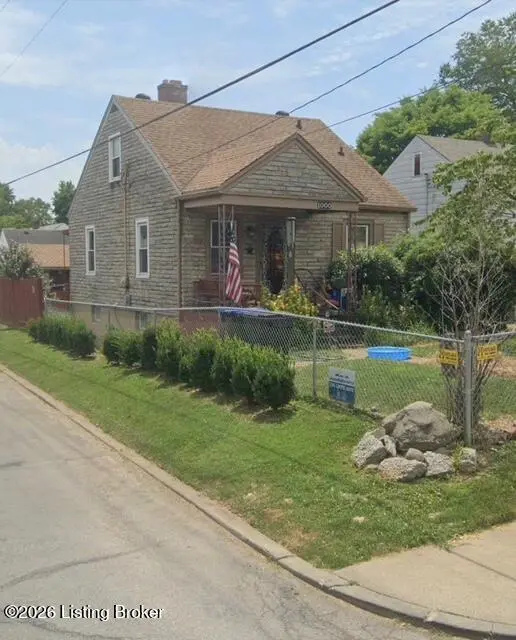
1000 Berry Blvd · Louisville, KY
Flood risk 5/10 · Moderate
- FEMA flood zone
- X (unshaded)
- Chance of flooding over 30 yrs
- 0.48%
- Est. flood insurance / yr
- $473 – $860
Fire risk 1/10 · Minimal
- Est. fire insurance / yr
- $839 – $1,559
Heat risk 5/10 · Moderate
- Hot days now (above 104°F)
- 7 days/yr
- Hot days in 30 yrs
- 20 days/yr
Wind risk 2/10 · Minimal
- Chance of severe wind over 30 yrs
- 1.0%
Air-quality risk 2/10 · Minimal
- Unhealthy air days now
- 1 days/yr
- Unhealthy air days in 30 yrs
- 3 days/yr
Risk factors via First Street. Map © Google.
Why this score? — see what drove the D grade
The composite is a weighted blend of 9 inputs, each scored 0–100. Each bar is that input's sub-score; the figure is the points it added to the 100-point composite (weight × sub-score).
- Cash flow +15.0/30.0
- ARV discount +7.5/15.0
- 1% rule +5.0/10.0
- DSCR +5.0/10.0
- Rent growth +3.8/5.0
- Livability +3.2/5.0
- Condition / age +2.5/5.0
- Schools +2.3/10.0
- Appreciation +0.0/10.0
$1
🖨 Deal sheet (PDF) 📄 Offer letter ✓ Due diligence
Listing remarks MLS
Don't let this one fool you! It's much bigger than it looks. The 1st floor has a bonus room and an eat-in kitchen with a pantry. All appliances to remain. The upstairs has a paneled dormer bedroom. The finished lower level has a family room, 2 additional bedrooms, a full bath and a laundry area. There are plenty of closets and storage areas. The fenced rear yard of this corner lot leads to a 2 car garage. Replacement windows and a covered front porch add to the many features of this house. Seller offering a one-year basic First American Home Warranty.
Key facts
- 3,964 sq ft lot
- Garage
- Built 1940
Property features AI
Finance
- Other: Subdivision: Thornberry
- HOA & community: No association fee
Exterior
- Parking: Detached garage (1 car)
- Utilities: Electricity connected
- Home design: Residential auction property; Other architectural style; Single-story
- Construction: Built in 1940; Wood frame construction; Other roof type; Partially finished basement (below grade finished and unfinished areas)
- Exterior features: Chain-link fence
Interior
- Kitchen: Kitchen located on the first floor
- Bedrooms: 2 bedrooms, both on the first floor
- Bathrooms: 1 full bathroom
- Heating & cooling: Heating present; Central air conditioning
- Interior features: Partially finished basement; Total of 4 rooms; Family room on the first floor
- Laundry & utility: No first-floor laundry
Neighborhood map
What this means for you Summary
Snapshot
- This is a 2-bed/1.0-bath single-family listed at $1.
Deal economics
- At list price, monthly cash flow is $1k ($14k/yr) — positive.
- The deal already cash-flows at list — no discount required.
- Meets the 1% rule at list price ($1k rent vs $1).
- Cap rate 1408081.4% vs local median 5.0% in Louisville — top-decile yield for the area; either an underpriced asset or a hidden risk that comps aren't pricing in. Stress-test before assuming the spread holds.
Location & tenants
- Location reads 63/100 on livability (#333 in KY) — a middle-class / working-renter tenant base. Strengths: cost of living A+, housing A+; Watch: employment C-, health & safety D+, crime F.
- Jefferson County (urban): math 19% / reading 35% proficiency, ranked #121 of 165 in KY (top 73%) — low school quality limits family demand, transient renter base, plan for 1-2y turnover.
- Zoned schools: Semple Elementary (math 2% / reading 12%, grade F, #662 of 676 statewide, top 99%, 574 students, 79% FRL); Frederick Law Olmsted Academy North (math 5% / reading 15%, grade F, #217 of 217 statewide, top 100%, 510 students, 74% FRL); Iroquois High (math 12% / reading 8%, grade F, #245 of 254 statewide, top 97%, 1,090 students, 74% FRL) — zoned schools average 76% FRL vs 56% district-wide (20 pts higher); higher-poverty schools than district average — tighter screening recommended.
- Zoned-school proficiency averages 9% at this address vs 27% district-wide (-18 pts) — the specific schools serving this property underperform the Jefferson County average; the district grade overstates school quality for this exact location.
- Market conditions: Rents rising fast (+5.2%/yr); 118 active listings in the ZIP; 22 comparable units currently listed for rent nearby; rentals at typical pace (median 18d on market — plan ~3-4 weeks tenant-placement turnaround); lower-income renter base — watch delinquency; 2,836 units permitted in Jefferson County in 2024 (1,558 in 5+ unit buildings).
- This rent runs 41% of the median local income ($44k/yr) — at the standard rent-burdened threshold; future hikes will face affordability resistance.
Forward outlook
- Local home prices are declining (-3.0%/yr); year-one equity from $0 of loan paydown is wiped out by about $0 of value loss. Plan a longer hold.
- Jefferson County population projected at +13% by 2050 — modest demand growth; plan on rents tracking national, not racing it.
- At projected returns (-3.0% appreciation + 5.2% rent growth), your $0 cash investment doubles in ~1 year — after that, you're playing with house money.
Negotiation context
- Only 14 days on market — expect competitive offers; lowballing is unlikely to land.
- 3 sale attempts since 14y ago with the ask held roughly flat each time — persistent listings suggest the price (not the market) is what's stuck; bring a comps-based counter.
Risks & watch-outs
- Watch-outs: built in 1940 — expect roof / HVAC / electrical / plumbing capex.
- Climate carrying-cost: moderate flood risk; extreme-heat days projected 7→20/yr by 2055 (HVAC capex compounding) — expect insurance premiums to compound above CPI over the hold.
Questions for the listing agent
- Built in 1940 — when were the roof, HVAC, electrical panel, plumbing, and water heater last replaced?
- Is there a deadline driving the sale (1031 exchange, divorce, estate, relocation)? That informs how much negotiation room exists.
- Schools are D-rated, which usually means shorter tenancies and higher turnover. Who's the typical renter profile here, and what's been the actual vacancy rate?
- Crime grade is F in this area — have there been break-ins, vandalism, or insurance claims at this property in the last 3 years? What carrier currently insures it and at what premium?
- The area grade is low — what's the realistic commute time and amenity access for the typical tenant pool here? Any planned neighborhood developments (good or bad) we should know about?
- What's the average days-on-market for RENTAL listings here right now (not sales)? A rising rental-DOM trend means longer vacancies and softer asking-rent achievability than the comps imply.
- What's the recent tenant-quality profile in this submarket — average credit score on applications, eviction rate, late-payment / NSF rate, and stable-employment percentage? A property-management company in the area should have these aggregated.
- How much new for-sale + rental construction is in the pipeline within 1–3 miles? Heavy new supply typically softens prices + rents 12–24 months out; constrained supply supports both.
Investment metrics
- 1% rule
- 148532.00% ✓
- Cap rate
- 1408081.36%
- Cash-on-cash
- 5028839.53%
- DSCR
- 223756.06
- GRM
- 0.0
CMA / ARV
- ARV (on-the-fly)
- $183,399
- Comps found
- 12
Show comp detail 12 sales within ~0.75 mi
| Address | Dist | Beds/Ba | Sqft | Sold | Price | $/sf | Match |
|---|---|---|---|---|---|---|---|
| 1119 Hathaway Ave | 0.21mi | 3/1.0 (+1) | 1,638 (+1%) | 4mo | $70,000 | $43 | 81 |
| 1123 W Whitney Ave | 0.26mi | 3/1.0 (+1) | 1,508 (-7%) | 2mo | $170,000 | $113 | 70 |
| 576 Longfield Ave | 0.32mi | 3/1.0 (+1) | 1,414 (-13%) | 1mo | $179,300 | $127 | 58 |
| 4103 Southern Pkwy | 0.59mi | 3/2.0 (+1) | 1,646 (+1%) | 7mo | $240,000 | $146 | 55 |
| 4613 N Rutland Ave | 0.74mi | 3/1.0 (+1) | 1,638 (+1%) | 8mo | $190,000 | $116 | 52 |
| 701 W Evelyn Ave | 0.34mi | 2/2.0 | 1,380 (-15%) | 6mo | $128,700 | $93 | 50 |
| 4513 S 6th St | 0.70mi | 3/2.0 (+1) | 1,581 (-3%) | 5mo | $195,800 | $124 | 50 |
| 1009 W Ashland Ave | 0.65mi | 3/2.0 (+1) | 1,525 (-6%) | 4mo | $240,000 | $157 | 48 |
| 4344 S 3rd St | 0.71mi | 3/2.0 (+1) | 1,742 (+7%) | 6mo | $172,000 | $99 | 41 |
| 1408 Mccoy Ave | 0.65mi | 3/1.0 (+1) | 1,424 (-12%) | 5mo | $131,000 | $92 | 40 |
| 1302 Weyler Ave | 0.68mi | 3/1.0 (+1) | 1,843 (+14%) | 7mo | $170,000 | $92 | 35 |
| 1121 Larchmont Ave | 0.74mi | 3/2.0 (+1) | 1,426 (-12%) | 3mo | $150,000 | $105 | 34 |
Match score weights: distance 35% · size 25% · config 20% · recency 20%. Top-matched comps best support the ARV.
Projected returns pro-forma
-3.0% appreciation · 5.16% rent growth · sell at horizon
- IRR
- —
- Equity multiple
- 278765.14×
- Total profit
- $78,054
- Equity at exit
- $0
- IRR
- —
- Equity multiple
- 637266.68×
- Total profit
- $178,434
- Equity at exit
- $0
Cash invested: $0 (down + closing). Projections, not guarantees.
Landlord ↔ Tenant lean methodology
- Overall (STATE)
- 83 Strongly Landlord-Friendly
- State Kentucky
- 83 Strongly Landlord-Friendly · R+16
- County
- — inherits STATE
- City
- — inherits STATE
ZIP-level market 40215
- Home prices YoY
- -34.4%
- Rents YoY
- 5.2%
- Active inventory
- 118
Monthly cashflow live
- Estimated rent
- $1,485 high interval (Pro) →
- Mortgage (P&I)
- −$0
- Tax est. 1.5%
- −$0 /mo · $0/yr
- Insurance
- −$0
- HOA
- −$0
- Vacancy / Maint / Mgmt
- −$312
- Net cashflow
- $1,173
Break-even live
Sensitivity live
| Price | -10% $1,173 | -5% $1,173 | +0% $1,173 | +5% $1,173 | +10% $1,173 |
|---|---|---|---|---|---|
| Rent | -10% $1,056 | -5% $1,115 | +0% $1,173 | +5% $1,232 | +10% $1,291 |
| Rate | -1.0pp $1,173 | -0.5pp $1,173 | base $1,173 | +0.5pp $1,173 | +1.0pp $1,173 |
UW: 25.0% down · 7.5% · 30yr · 1.5% tax · 5.0% vac · 8.0% maint · 8.0% mgmt
Financing live
Cash to close
- Down payment
- $0
- Closing costs
- $0
- Reserves months
- —
- Total cash needed
- —
Loan-product check · same deal, 3 products live
Conventional
25% down · 7.5% · 30yr
- Down + closing
- —
- Monthly P&I
- —
- Monthly cashflow
- —
- DSCR
- —
- Eligible?
- —
Personal DTI + credit; lowest rate.
DSCR
20% down · 8.5% · 30yr
- Down + closing
- —
- Monthly P&I
- —
- Monthly cashflow
- —
- DSCR
- —
- Eligible?
- —
No personal income docs; deal must DSCR.
Hard money
10% down · 12.0% · 12mo
- Down + closing
- —
- Monthly P&I
- —
- Monthly cashflow
- —
- DSCR
- —
- Eligible?
- —
Short-term bridge; refi at stabilization.
Rent comps 22 comps
| Address | Beds | Baths | Sqft | Rent | $/sqft | DOM | Units | Dist |
|---|---|---|---|---|---|---|---|---|
| 925 W Evelyn Ave Louisville, KY | 3.0 | 1.5 | 1520 | $1,650 | $1.09 | 25d | 1 | 0.07mi |
| 910 W Whitney Ave Louisville, KY | 3.0 | 1.0 | 1186 | $1,450 | $1.22 | 3d | 1 | 0.18mi |
| 910 W Whitney Ave Louisville, KY | 3.0 | 1.0 | 1186 | $1,450 | $1.22 | 13d | 1 | 0.18mi |
| 551 Denmark St Louisville, KY | 3.0 | 1.5 | 1160 | $1,700 | $1.47 | 25d | 1 | 0.33mi |
| 3860 Southern Pkwy Louisville, KY | 3.0 | 1.0 | 1064 | $1,250 | $1.17 | 25d | 1 | 0.55mi |
| 310 W Kenton St Louisville, KY | 3.0 | 2.0 | 1295 | $1,350 | $1.04 | 25d | 1 | 0.63mi |
| 1522 Clara Ave Louisville, KY | 3.0 | 2.0 | 1150 | $1,150 | $1.00 | 25d | 1 | 0.64mi |
| 4513 S 6th St Louisville, KY | 3.0 | 2.0 | 1581 | $2,650 | $1.68 | 25d | 1 | 0.70mi |
| 3717 Wheeler Ave Louisville, KY | 3.0 | 2.0 | 1124 | $1,450 | $1.29 | 25d | 1 | 0.72mi |
| 1305 Larchmont Ave Louisville, KY | 2.0 | 1.0 | 1113 | $1,350 | $1.21 | 17d | 1 | 0.95mi |
| 114 E Florence Ave Unit 19 Louisville, KY | 2.0 | 2.0 | 1080 | $1,295 | $1.20 | 17d | 1 | 0.97mi |
| 4406 S Brook St Apt 27 Louisville, KY | 2.0 | 2.0 | 1080 | $1,295 | $1.20 | 13d | 1 | 0.98mi |
| 4608 S 3rd St Unit 1st Floor Louisville, KY | 2.0 | 1.5 | 1100 | $1,500 | $1.36 | 25d | 1 | 1.05mi |
| 315 M St Unit 101 Louisville, KY | 3.0 | 1.5 | 1200 | $1,800 | $1.50 | 13d | 1 | 1.15mi |
| 4725 Southern Pkwy Unit 1 Louisville, KY | 2.0 | 1.0 | 1296 | $925 | $0.71 | 5d | 1 | 1.15mi |
| 2718 S 3rd St Unit 1 Louisville, KY | 2.0 | 1.0 | 1200 | $1,400 | $1.17 | 13d | 1 | 1.19mi |
| 500 Montana Ave Louisville, KY | 2.0 | 1.0 | 1191 | $1,200 | $1.01 | 16d | 1 | 1.23mi |
| 1161 Lincoln Ave Louisville, KY | 2.0 | 1.5 | 1358 | $1,150 | $0.85 | 17d | 1 | 1.27mi |
| 516 Colorado Ave Louisville, KY | 3.0 | 2.0 | 2000 | $1,800 | $0.90 | 17d | 1 | 1.38mi |
| 510 Colorado Ave Louisville, KY | 3.0 | 2.0 | 1500 | $1,750 | $1.17 | 25d | 1 | 1.39mi |
| 2501 S 3rd St Louisville, KY | 1.0–2.0 | 1.0–2.0 | 1011 | $1,550 | $1.53 | 5d | 2 | 1.39mi |
| 2501 S 4th St Louisville, KY | 1.0–3.0 | 1.0–3.0 | 897 | $3,732 | $4.16 | 5d | 1 | 1.42mi |
Listing history 6 events
-
2026-05-06status Pending
-
2026-04-22$1 Active
-
2013-06-20soldstatus $70,000 557-char remark
Show marketing remark (557 chars)
Don't let this one fool you! It's much bigger than it looks. The 1st floor has a bonus room and an eat-in kitchen with a pantry. All appliances to remain. The upstairs has a paneled dormer bedroom. The finished lower level has a family room, 2 additional bedrooms, a full bath and a laundry area. There are plenty of closets and storage areas. The fenced rear yard of this corner lot leads to a 2 car garage. Replacement windows and a covered front porch add to the many features of this house. Seller offering a one-year basic First American Home Warranty.
-
2013-05-28$74,900 557-char remark
Show marketing remark (557 chars)
Don't let this one fool you! It's much bigger than it looks. The 1st floor has a bonus room and an eat-in kitchen with a pantry. All appliances to remain. The upstairs has a paneled dormer bedroom. The finished lower level has a family room, 2 additional bedrooms, a full bath and a laundry area. There are plenty of closets and storage areas. The fenced rear yard of this corner lot leads to a 2 car garage. Replacement windows and a covered front porch add to the many features of this house. Seller offering a one-year basic First American Home Warranty.
-
2013-05-25historical
-
2012-12-04$74,900
ⓘ Source: listings_history table (triggers on properties + properties_extension) + one-shot
backfill from property_details.listing_events for pre-trigger history.
Climate risk First Street
- Flood 5/10 Major FEMA zone X (unshaded) · 48% chance over 30 yrs
- Wildfire 1/10 Low
- Heat 5/10 Major 7 d/yr ≥104°F today · 20 d/yr by 30 yrs out
- Wind 2/10 Low 100% chance of damaging wind over 30 yrs
- Air quality 2/10 Low 1 unhealthy d/yr today · 3 by 30 yrs out
Nearby sold comps map
Loading sold comps map…
Walkable amenities ~0.75 mi
Loading nearby amenities…
Taxation est. · year 1
- Rental income
- $17,824
- − Mortgage interest
- −$0
- − Property taxes
- −$0
- − Insurance
- −$0
- − Repairs & maintenance
- −$1,426
- − Management
- −$1,426
- − Depreciation
- −$0
- Taxable income
- $14,972
- Est. tax owed @ 24.0%
- −$3,593
- After-tax cash flow
- $10,487/yr
For passive investors: Depreciation is non-cash, so a rental often shows a tax loss while cash-flowing — sheltering income. Rental losses are passive: they offset passive income freely, and up to $25,000/yr can offset ordinary (W-2) income if you actively participate and your MAGI is under $100k (phasing out to $0 by $150k); unused losses carry forward. On sale, claimed depreciation is recaptured at up to 25%, and gains may owe capital-gains tax (a 1031 exchange can defer both). Figures are a year-1 estimate at your 24.0% rate — not tax advice; consult a CPA.
Schools (NCES district)
- District
- Jefferson County
- NCES district ID
- 2102990
- Math proficiency
- 19% ▼ -17.00%
- Reading proficiency
- 35% ▼ -11.00%
- Median HH income
- $47,885
- Composite
- 23.45/100
- National rank
- #7884
- State rank
- #121 of 165 in KY
Livability — Louisville
- Score
- 63/100
- State rank
- #333
- US rank
- #15887
Category grades
Schools grade is shown separately in the Schools card above.
Census & demographics
- Census place
- Louisville, KY
- County
- Jefferson County · 790,184 people
- City population
- 769,292
- Metro
- Louisville/Jefferson County, KY-IN
- Population (ZIP)
- 20,532
- Household income
- $43,725
- Rent vs Own
- Severe rent burden
- 997.0
Population outlook (Jefferson County) Hauer SSP2
- Today (2025)
- 823,112 people
- By 2030
- 849,343 · +3.2%
- By 2040
- 895,696 · +8.8%
- By 2050
- 933,630 · +13.4%
- By 2075
- 1,028,262 · +24.9%
- By 2100
- 1,072,675 · +30.3%
Race, ethnicity, and origin ACS 2023
- Neighborhood character
- Diverse neighborhood (Simpson 0.63)
- Race & ethnicity
- White 51% Black 33% Two or more races 11% Hispanic / Latino 6% Asian 2%
- Hispanic origin (detail)
- Mexican 2% Cuban 3%
- Common ancestry
- Slovak 1% Romanian 1% Serbian 1%
- Foreign-born
- 9% · Canada, Vietnam
- Languages at home
- 88% English-only · Spanish 5% Other Indo-European 2% Arabic 1%
Political lean MEDSL · Jefferson
- 2024 margin
- D (+16.6) · D 57.4% · R 40.9% · Other 1.7%
- 2008→2024 swing
- +4.5pp toward D · 2008: 12.0pp · 2024: 16.6pp
- All cycles
- 2024: D+16.6 2020: D+20.1 2016: D+13.3 2012: D+11.1 2008: D+12.0
Not yet ingested
- Civics
- —
Market trends
- HPI YoY
- ▼ -119.35%
- Current HPI
- 227.8248
- Rent YoY
- ▲ 5.16%
- Metro
- Louisville/Jefferson County, KY-IN
- State GDP YoY
- ▲ 1.81%
- F500 in state
- 4
Industry mix (Fortune 500 HQ in KY)
| Industry | F500 HQs | Revenue |
|---|---|---|
| Healthcare | 1 | $118B |
|
||
| Food / Beverage | 1 | $7B |
|
||
Price history
-6.5% since first listed6 events — show timeline
- 2026-05-06 Pending — Metro Search MLS
- 2026-04-22 Listed $1 Metro Search MLS
- 2013-06-20 Sold (MLS) $70,000 Metro Search MLS
- 2013-05-28 Listed $74,900 Metro Search MLS
- 2013-05-25 Listing Removed — Metro Search MLS
- 2012-12-04 Listed $74,900 Metro Search MLS
Property tax history
+6.9%/yrLatest (2025): $824 · -5.8% YoY. Source: county tax records.
Cash-flow waterfall
monthlySold comps — $/sqft
last 12 mo · ≤1 miLoading sold comps…