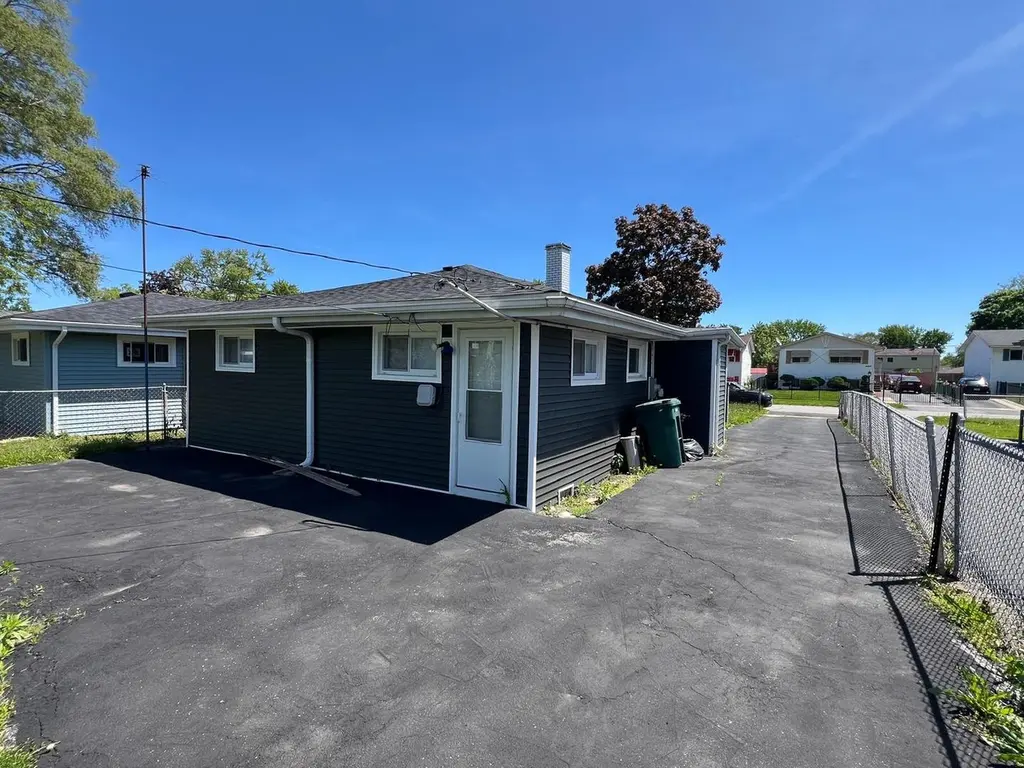
16442 Honore Ave
Markham, IL 60428
$165,000B-
3 bd · 1.0 ba ·
1,044 sqft ·
Built 1954
· SingleFamily
· Active
· 30 DOM
Cashflow @ list (25.0% down · 7.5%)
Estimated rent
$2,275/mo
Mortgage (P&I)
−$865
Tax + insurance
−$451
HOA
−$0
Vac / Maint / Mgmt
−$478
Net cashflow
$481/mo
Annual
$5,770/yr
Cap rate
9.79%
Cash-on-cash
12.49%
DSCR
1.56
1% rule
1.38%
Cash to close
$46,200
Investor read
- This is a 3-bed/1.0-bath single-family listed at $165k.
- At list price, monthly cash flow is $481 ($6k/yr) — positive.
- The deal already cash-flows at list — no discount required.
- Meets the 1% rule at list price ($2k rent vs $165k).
- It's been on market 30 days — a 2% lower offer ($163k) is reasonable based on typical stale-listing flexibility.
- Recommended offer: $163k (1.5% below list) — sets the bar for market timing.
- In year one you build about $18k of equity ($1k loan paydown + $16k appreciation (10.0% local appreciation)).
- Location reads 76/100 on livability (#186 in IL, #3,539 nationally) — a middle-class / working-renter tenant base. Strengths: commute A+, cost of living A+, housing A+; Watch: crime D, amenities D, employment D.
- Thornton Twp Hsd 205 (suburban): math 7% / reading 8% proficiency, ranked #594 of 620 in IL (top 96%) — low school quality limits family demand, transient renter base, plan for 1-2y turnover.
- Zoned schools: Barack H Obama Learning Academy (math 24% / reading 24%, grade F, #850 of 2,056 statewide, top 45%, 468 students, 0% FRL); Thornwood High School (math 8% / reading 9%, grade F, #584 of 693 statewide, top 85%, 1,996 students, 0% FRL).
- Watch-outs: property tax is 2.8% of price; built in 1954 — expect roof / HVAC / electrical / plumbing capex.
- Market conditions: 66 active listings in the ZIP; 8 comparable units currently listed for rent nearby; rentals leasing fast (median 0d on market — plan ~1-2 weeks tenant-placement turnaround); 6,272 units permitted in Cook County in 2024 (4,658 in 5+ unit buildings).
- 4 sale attempts since 20y ago with the ask held roughly flat each time — persistent listings suggest the price (not the market) is what's stuck; bring a comps-based counter.
- Current owner paid $81k; list at $165k implies a 104% gain — meaningful room to come down on a strong offer.
- At projected returns (10.0% appreciation + 3.0% rent growth), your $46k cash investment doubles in ~2 years — after that, you're playing with house money.
- By year 3, paydown + projected appreciation supports a ~$45k cash-out refi (75% LTV) — recoverable capital for the next deal without selling this one.
- Climate carrying-cost: major flood risk — expect insurance premiums to compound above CPI over the hold.
Questions for listing agent
- Built in 1954 — when were the roof, HVAC, electrical panel, plumbing, and water heater last replaced?
- Property tax is high relative to price — has the assessment been appealed recently, and will the sale trigger a re-assessment?
- Is there a deadline driving the sale (1031 exchange, divorce, estate, relocation)? That informs how much negotiation room exists.
- Schools are F-rated, which usually means shorter tenancies and higher turnover. Who's the typical renter profile here, and what's been the actual vacancy rate?
- Crime grade is D in this area — have there been break-ins, vandalism, or insurance claims at this property in the last 3 years? What carrier currently insures it and at what premium?
- What's the average days-on-market for RENTAL listings here right now (not sales)? A rising rental-DOM trend means longer vacancies and softer asking-rent achievability than the comps imply.
- What's the recent tenant-quality profile in this submarket — average credit score on applications, eviction rate, late-payment / NSF rate, and stable-employment percentage? A property-management company in the area should have these aggregated.
- How much new for-sale + rental construction is in the pipeline within 1–3 miles? Heavy new supply typically softens prices + rents 12–24 months out; constrained supply supports both.
CashFlowRE · CFR-K6SMJ71QZNDMR8
· Data 1 day ago
cashflowre.app · 2026-05-29