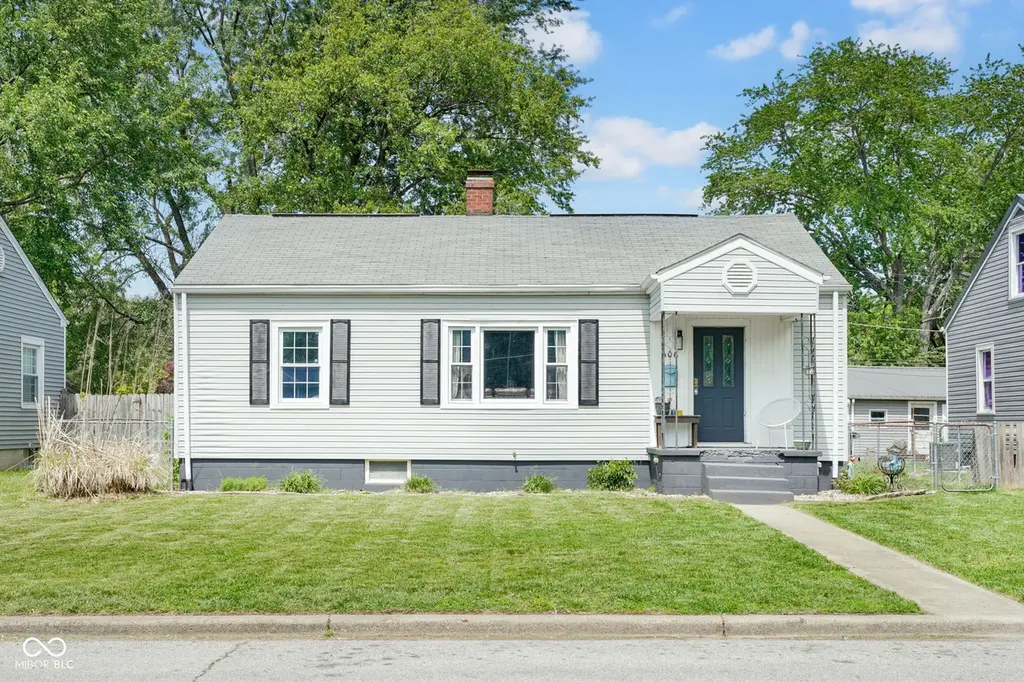
606 W 7th St
Seymour, IN 47274
$174,900F
3 bd · 1.0 ba ·
912 sqft ·
Built 1948
· SingleFamily
· Pending
· 7 DOM
Cashflow @ list (25.0% down · 7.5%)
Estimated rent
$1,332/mo
Mortgage (P&I)
−$917
Tax + insurance
−$137
HOA
−$0
Vac / Maint / Mgmt
−$280
Net cashflow
$-2/mo
Annual
$-24/yr
Cap rate
6.28%
Cash-on-cash
-0.05%
DSCR
1.00
1% rule
0.76%
Cash to close
$48,972
Investor read
- This is a 3-bed/1.0-bath single-family listed at $175k.
- At list price, monthly cash flow is $-2 ($-24/yr) — negative.
- To cash-flow at today's rent, offer at most $175k (0.2% below list).
- To meet the 1% rule (rent ≥ 1% of price), the offer needs to be $133k (23.9% below list).
- Only 7 days on market — expect competitive offers; lowballing is unlikely to land.
- Recommended offer: $133k (23.9% below list) — sets the bar for 1% rule.
- Local home prices are declining (-3.0%/yr); year-one equity from $1k of loan paydown is wiped out by about $5k of value loss. Plan a longer hold.
- Location reads 68/100 on livability (#211 in IN) — a middle-class / working-renter tenant base. Strengths: crime A+, cost of living A+, housing A+; Watch: employment D+, health & safety D, amenities F.
- Seymour Community Schools (town): math 27% / reading 33% proficiency, ranked #239 of 301 in IN (top 79%) — families likely to look elsewhere, expect single-tenant / working-renter base with shorter leases.
- Zoned schools: Emerson Elementary School (math 57% / reading 52%, grade C, #197 of 994 statewide, top 22%, 323 students, 53% FRL); Seymour Middle School (math 20% / reading 30%, grade F, #247 of 330 statewide, top 76%, 1,178 students, 71% FRL); Seymour Senior High School (math 29% / reading 55%, grade F, #197 of 369 statewide, top 57%, 1,690 students, 57% FRL).
- Watch-outs: built in 1948 — expect roof / HVAC / electrical / plumbing capex.
- Market conditions: 255 active listings in the ZIP; 101 units permitted in Jackson County in 2024 (0 in 5+ unit buildings).
- Jackson County population projected at +7% by 2050 — modest demand growth; plan on rents tracking national, not racing it.
- 7 sale attempts since 21y ago with the ask held roughly flat each time — persistent listings suggest the price (not the market) is what's stuck; bring a comps-based counter.
- Current owner paid $88k; list at $175k implies a 98% gain — meaningful room to come down on a strong offer.
- Cap rate 6.3% vs local median 3.4% in Seymour — top-decile yield for the area; either an underpriced asset or a hidden risk that comps aren't pricing in. Stress-test before assuming the spread holds.
Questions for listing agent
- What do current leases actually rent for vs. the listed asking? Can we see a recent rent roll and the last 12 months of T-12 income?
- Built in 1948 — when were the roof, HVAC, electrical panel, plumbing, and water heater last replaced?
- Is there a deadline driving the sale (1031 exchange, divorce, estate, relocation)? That informs how much negotiation room exists.
- The area grade is low — what's the realistic commute time and amenity access for the typical tenant pool here? Any planned neighborhood developments (good or bad) we should know about?
- What's the average days-on-market for RENTAL listings here right now (not sales)? A rising rental-DOM trend means longer vacancies and softer asking-rent achievability than the comps imply.
- What's the recent tenant-quality profile in this submarket — average credit score on applications, eviction rate, late-payment / NSF rate, and stable-employment percentage? A property-management company in the area should have these aggregated.
- How much new for-sale + rental construction is in the pipeline within 1–3 miles? Heavy new supply typically softens prices + rents 12–24 months out; constrained supply supports both.
CashFlowRE · CFR-K6TQS7FNM629ZW
· Data 4 weeks ago
cashflowre.app · 2026-05-29