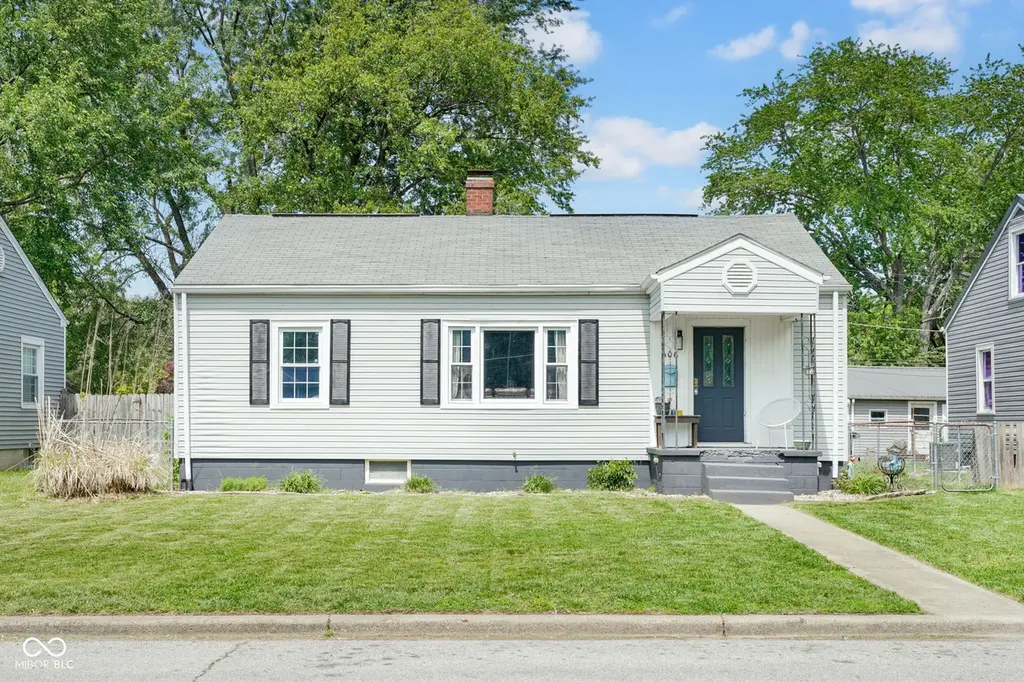
606 W 7th St · Seymour, IN
Flood risk 1/10 · Minimal
- FEMA flood zone
- X (unshaded)
- Chance of flooding over 30 yrs
- 0.0%
- Est. flood insurance / yr
- $473 – $860
Fire risk 1/10 · Minimal
- Est. fire insurance / yr
- $717 – $1,331
Heat risk 4/10 · Minor
- Hot days now (above 103°F)
- 7 days/yr
- Hot days in 30 yrs
- 19 days/yr
Wind risk 2/10 · Minimal
- Chance of severe wind over 30 yrs
- 1.0%
Air-quality risk 1/10 · Minimal
- Unhealthy air days now
- 0 days/yr
- Unhealthy air days in 30 yrs
- 0 days/yr
Risk factors via First Street. Map © Google.
Why this score? — see what drove the F grade
The composite is a weighted blend of 9 inputs, each scored 0–100. Each bar is that input's sub-score; the figure is the points it added to the 100-point composite (weight × sub-score).
- Cash flow +13.2/30.0
- DSCR +4.0/10.0
- Livability +3.4/5.0
- 1% rule +2.6/10.0
- Schools +2.6/10.0
- Rent growth +2.5/5.0
- Condition / age +2.5/5.0
- ARV discount +0.0/15.0
- Appreciation +0.0/10.0
$174,900
🖨 Deal sheet (PDF) 📄 Offer letter ✓ Due diligence
Listing remarks MLS
Great starter home in quiet neighborhood. This home has 3 bedrooms and one full bath. Home has been painted throughout. Full basement for extra storage. Full fenced in back yard with a detached garage. Brand new furnace and A/C units. Priced to sell.
Key facts
- Spacious family room
- 7,425 sq ft lot
- Garage
Tags
Property features AI
Finance
- Other: Lot under 1/4 acre (approximately 0.17 acre); Approximately 1,596 living area with additional finished lower level
Exterior
- Parking: Detached garage (1 car)
- Utilities: Public water; Municipal sewer; 200+ amp electric service
- Home design: Single family residence; One level
- Construction: Vinyl siding; Block foundation
- Exterior features: Patio; Outbuilding
Interior
- Kitchen: Dishwasher; Electric oven; Refrigerator
- Bedrooms: Three bedrooms on the main level (main level bedrooms: 3)
- Flooring: Hardwood
- Bathrooms: Two full bathrooms (one on main level, one in basement)
- Heating & cooling: Forced air heating (natural gas); Central air conditioning
- Interior features: Hardwood floors; Eat-in kitchen; Full finished basement
- Laundry & utility: Laundry room in basement
Neighborhood map
What this means for you Summary
Snapshot
- This is a 3-bed/1.0-bath single-family listed at $175k.
Deal economics
- At list price, monthly cash flow is $-2 ($-24/yr) — negative.
- To cash-flow at today's rent, offer at most $175k (0.2% below list).
- To meet the 1% rule (rent ≥ 1% of price), the offer needs to be $133k (23.9% below list).
- Recommended offer: $133k (23.9% below list) — sets the bar for 1% rule.
- Cap rate 6.3% vs local median 3.4% in Seymour — top-decile yield for the area; either an underpriced asset or a hidden risk that comps aren't pricing in. Stress-test before assuming the spread holds.
Location & tenants
- Location reads 68/100 on livability (#211 in IN) — a middle-class / working-renter tenant base. Strengths: crime A+, cost of living A+, housing A+; Watch: employment D+, health & safety D, amenities F.
- Seymour Community Schools (town): math 27% / reading 33% proficiency, ranked #239 of 301 in IN (top 79%) — families likely to look elsewhere, expect single-tenant / working-renter base with shorter leases.
- Zoned schools: Emerson Elementary School (math 57% / reading 52%, grade C, #197 of 994 statewide, top 22%, 323 students, 53% FRL); Seymour Middle School (math 20% / reading 30%, grade F, #247 of 330 statewide, top 76%, 1,178 students, 71% FRL); Seymour Senior High School (math 29% / reading 55%, grade F, #197 of 369 statewide, top 57%, 1,690 students, 57% FRL).
- Market conditions: 255 active listings in the ZIP; 101 units permitted in Jackson County in 2024 (0 in 5+ unit buildings).
Forward outlook
- Local home prices are declining (-3.0%/yr); year-one equity from $1k of loan paydown is wiped out by about $5k of value loss. Plan a longer hold.
- Jackson County population projected at +7% by 2050 — modest demand growth; plan on rents tracking national, not racing it.
Negotiation context
- Only 7 days on market — expect competitive offers; lowballing is unlikely to land.
- 7 sale attempts since 21y ago with the ask held roughly flat each time — persistent listings suggest the price (not the market) is what's stuck; bring a comps-based counter.
- Current owner paid $88k; list at $175k implies a 98% gain — meaningful room to come down on a strong offer.
Risks & watch-outs
- Watch-outs: built in 1948 — expect roof / HVAC / electrical / plumbing capex.
Questions for the listing agent
- What do current leases actually rent for vs. the listed asking? Can we see a recent rent roll and the last 12 months of T-12 income?
- Built in 1948 — when were the roof, HVAC, electrical panel, plumbing, and water heater last replaced?
- Is there a deadline driving the sale (1031 exchange, divorce, estate, relocation)? That informs how much negotiation room exists.
- The area grade is low — what's the realistic commute time and amenity access for the typical tenant pool here? Any planned neighborhood developments (good or bad) we should know about?
- What's the average days-on-market for RENTAL listings here right now (not sales)? A rising rental-DOM trend means longer vacancies and softer asking-rent achievability than the comps imply.
- What's the recent tenant-quality profile in this submarket — average credit score on applications, eviction rate, late-payment / NSF rate, and stable-employment percentage? A property-management company in the area should have these aggregated.
- How much new for-sale + rental construction is in the pipeline within 1–3 miles? Heavy new supply typically softens prices + rents 12–24 months out; constrained supply supports both.
Investment metrics
- 1% rule
- 0.76% ✗
- Cap rate
- 6.28%
- Cash-on-cash
- -0.05%
- DSCR
- 1.00
- GRM
- 10.9
CMA / ARV
- ARV (on-the-fly)
- $141,360
- Comps found
- 6
Show comp detail 6 sales within ~0.75 mi
| Address | Dist | Beds/Ba | Sqft | Sold | Price | $/sf | Match |
|---|---|---|---|---|---|---|---|
| 425 Lee Blvd | 0.40mi | 3/1.0 | 900 (-1%) | 13mo | $174,900 | $194 | 68 |
| 314 N Elm St | 0.38mi | 2/1.0 (-1) | 980 (+8%) | 2mo | $133,000 | $136 | 63 |
| 110 E 9th St | 0.43mi | 3/2.0 | 990 (+9%) | 12mo | $150,000 | $152 | 52 |
| 201 Lee Blvd | 0.58mi | 2/1.0 (-1) | 1,032 (+13%) | 3mo | $160,000 | $155 | 43 |
| 119 E 13th St | 0.58mi | 3/1.0 | 1,014 (+11%) | 19mo | $120,000 | $118 | 39 |
| 208 Kessler Blvd | 0.58mi | 2/1.0 (-1) | 816 (-10%) | 17mo | $144,000 | $176 | 36 |
Match score weights: distance 35% · size 25% · config 20% · recency 20%. Top-matched comps best support the ARV.
Projected returns pro-forma
-3.0% appreciation · 3.0% rent growth · sell at horizon
- IRR
- -16.4%
- Equity multiple
- 0.42×
- Total profit
- $-28,543
- Equity at exit
- $26,078
- IRR
- -8.3%
- Equity multiple
- 0.48×
- Total profit
- $-25,323
- Equity at exit
- $15,122
Cash invested: $48,972 (down + closing). Projections, not guarantees.
Landlord ↔ Tenant lean methodology
- Overall (STATE)
- 90 Strongly Landlord-Friendly
- State Indiana
- 90 Strongly Landlord-Friendly · R+11
- County
- — inherits STATE
- City
- — inherits STATE
ZIP-level market 47274
- Active inventory
- 255
- Price-to-rent
- 10.9×
Monthly cashflow live
- Estimated rent
- $1,332 medium interval (Pro) →
- Mortgage (P&I)
- −$917
- Tax from tax record
- −$64 /mo · $769/yr
- Insurance
- −$73
- HOA
- −$0
- Vacancy / Maint / Mgmt
- −$280
- Net cashflow
- $-2
Break-even live
Sensitivity live
| Price | -10% $97 | -5% $48 | +0% $-2 | +5% $-51 | +10% $-101 |
|---|---|---|---|---|---|
| Rent | -10% $-107 | -5% $-55 | +0% $-2 | +5% $51 | +10% $103 |
| Rate | -1.0pp $86 | -0.5pp $42 | base $-2 | +0.5pp $-47 | +1.0pp $-93 |
UW: 25.0% down · 7.5% · 30yr · 1.5% tax · 5.0% vac · 8.0% maint · 8.0% mgmt
Financing live
Cash to close
- Down payment
- $43,725
- Closing costs
- $5,247
- Reserves months
- —
- Total cash needed
- —
Loan-product check · same deal, 3 products live
Conventional
25% down · 7.5% · 30yr
- Down + closing
- —
- Monthly P&I
- —
- Monthly cashflow
- —
- DSCR
- —
- Eligible?
- —
Personal DTI + credit; lowest rate.
DSCR
20% down · 8.5% · 30yr
- Down + closing
- —
- Monthly P&I
- —
- Monthly cashflow
- —
- DSCR
- —
- Eligible?
- —
No personal income docs; deal must DSCR.
Hard money
10% down · 12.0% · 12mo
- Down + closing
- —
- Monthly P&I
- —
- Monthly cashflow
- —
- DSCR
- —
- Eligible?
- —
Short-term bridge; refi at stabilization.
Listing history 15 events
-
2026-05-21status Pending
-
2026-05-19status Active
-
2026-04-28status Pending
-
2026-04-22$174,900 Active
-
2012-05-29soldstatus $88,500
-
2012-05-23soldstatus $88,500 250-char remark
Show marketing remark (249 chars)
Great starter home in quiet neighborhood. This home has 3 bedrooms and one full bath. Home has been painted throughout. Full basement for extrastorage. Full fenced in back yard with a detached garage. Brand new furnace and A/C units. Priced to sell.
-
2012-05-23soldstatus $88,500 249-char remark
Show marketing remark (249 chars)
Great starter home in quiet neighborhood. This home has 3 bedrooms and one full bath. Home has been painted throughout. Full basement for extrastorage. Full fenced in back yard with a detached garage. Brand new furnace and A/C units. Priced to sell.
-
2012-03-14$89,900 250-char remark
Show marketing remark (249 chars)
Great starter home in quiet neighborhood. This home has 3 bedrooms and one full bath. Home has been painted throughout. Full basement for extrastorage. Full fenced in back yard with a detached garage. Brand new furnace and A/C units. Priced to sell.
-
2012-03-14$89,900 249-char remark
Show marketing remark (249 chars)
Great starter home in quiet neighborhood. This home has 3 bedrooms and one full bath. Home has been painted throughout. Full basement for extrastorage. Full fenced in back yard with a detached garage. Brand new furnace and A/C units. Priced to sell.
-
2012-01-31historical
-
2012-01-30historical
-
2011-10-31$89,900
-
2011-10-31$89,900
-
2005-07-20soldstatus $87,500
-
2005-06-23$86,900
ⓘ Source: listings_history table (triggers on properties + properties_extension) + one-shot
backfill from property_details.listing_events for pre-trigger history.
Tax reassessment forecast IN · Partial reset (capped growth)
- Current annual tax
- $769 · $64/mo
- Projected year-2 tax
- $1,128 · $94/mo
- Expected delta
- +$359/yr (+$30/mo · 46.7%)
ⓘ Screening estimate from a state-policy table — verify with the county assessor before closing.
Climate risk First Street
- Flood 1/10 Low FEMA zone X (unshaded) · 0% chance over 30 yrs
- Wildfire 1/10 Low
- Heat 4/10 Moderate 7 d/yr ≥103°F today · 19 d/yr by 30 yrs out
- Wind 2/10 Low 100% chance of damaging wind over 30 yrs
- Air quality 1/10 Low 0 unhealthy d/yr today · 0 by 30 yrs out
Nearby sold comps map
Loading sold comps map…
Walkable amenities ~0.75 mi
Loading nearby amenities…
Taxation est. · year 1
- Rental income
- $15,982
- − Mortgage interest
- −$9,797
- − Property taxes
- −$769
- − Insurance
- −$874
- − Repairs & maintenance
- −$1,279
- − Management
- −$1,279
- − Depreciation
- −$5,088
- Taxable loss
- −$3,104
- Est. tax savings @ 24.0%
- +$745
- After-tax cash flow
- $721/yr
For passive investors: Depreciation is non-cash, so a rental often shows a tax loss while cash-flowing — sheltering income. Rental losses are passive: they offset passive income freely, and up to $25,000/yr can offset ordinary (W-2) income if you actively participate and your MAGI is under $100k (phasing out to $0 by $150k); unused losses carry forward. On sale, claimed depreciation is recaptured at up to 25%, and gains may owe capital-gains tax (a 1031 exchange can defer both). Figures are a year-1 estimate at your 24.0% rate — not tax advice; consult a CPA.
Schools (NCES district)
- District
- Seymour Community Schools
- NCES district ID
- 1810080
- Math proficiency
- 27% ▼ -10.00%
- Reading proficiency
- 33% ▼ -9.00%
- Median HH income
- $46,122
- Composite
- 25.81/100
- National rank
- #7362
- State rank
- #239 of 301 in IN
Livability — Seymour
- Score
- 68/100
- State rank
- #211
- US rank
- #9328
Category grades
Schools grade is shown separately in the Schools card above.
Census & demographics
- Census place
- Seymour, IN
- County
- Jackson County · 33,068 people
- City population
- 33,068
- Metro
- Seymour, IN
- Population (ZIP)
- 33,068
- Household income
- $71,457
- Rent vs Own
- Severe rent burden
- 453.0
Population outlook (Jackson County) Hauer SSP2
- Today (2025)
- 46,376 people
- By 2030
- 47,344 · +2.1%
- By 2040
- 48,936 · +5.5%
- By 2050
- 49,738 · +7.2%
- By 2075
- 50,435 · +8.8%
- By 2100
- 46,321 · -0.1%
Race, ethnicity, and origin ACS 2023
- Neighborhood character
- Predominantly White (74%)
- Race & ethnicity
- White 74% Hispanic / Latino 18% Two or more races 12% Asian 3% Black 1% Native American 1%
- Hispanic origin (detail)
- Mexican 10% Puerto Rican 2%
- Common ancestry
- Slovak 2% Romanian 2% Iranian 1%
- Foreign-born
- 11% · Canada
- Languages at home
- 85% English-only · Spanish 12% Other Asian/Pacific 2% Other Indo-European 1%
Political lean MEDSL · Jackson
- 2024 margin
- Solid R (+55.3) · D 21.5% · R 76.8% · Other 1.7%
- 2008→2024 swing
- -41.6pp toward R · 2008: -13.7pp · 2024: -55.3pp
- All cycles
- 2024: R+55.3 2020: R+53.3 2016: R+51.4 2012: R+27.4 2008: R+13.7
Not yet ingested
- Civics
- —
Market trends
- HPI YoY
- ▼ -146.47%
- Current HPI
- 211.9507
- Rent YoY
- —
- Metro
- Seymour, IN
- State GDP YoY
- ▲ 2.90%
- F500 in state
- 18
Industry mix (Fortune 500 HQ in IN)
| Industry | F500 HQs | Revenue |
|---|---|---|
| Industrial Machinery | 2 | $37B |
|
||
| Healthcare | 1 | $177B |
|
||
| Pharmaceuticals | 1 | $45B |
|
||
| Metals / Steel | 1 | $18B |
|
||
| Agriculture | 1 | $17B |
|
||
| Packaging | 1 | $12B |
|
||
Price history
+101.3% since first listed15 events — show timeline
- 2026-05-21 Pending — MIBOR as Distributed by MLS Grid
- 2026-05-19 Relisted — MIBOR as Distributed by MLS Grid
- 2026-04-28 Pending — MIBOR as Distributed by MLS Grid
- 2026-04-22 Listed $174,900 MIBOR as Distributed by MLS Grid
- 2012-05-29 Sold (Public Records) $88,500 Public Records
- 2012-05-23 Sold (MLS) $88,500 MIBOR as Distributed by MLS Grid
- 2012-05-23 Sold (MLS) $88,500 MIBOR as Distributed by MLS Grid
- 2012-03-14 Listed $89,900 MIBOR as Distributed by MLS Grid
- 2012-03-14 Listed $89,900 MIBOR as Distributed by MLS Grid
- 2012-01-31 Listing Removed — MIBOR as Distributed by MLS Grid
- 2012-01-30 Listing Removed — MIBOR as Distributed by MLS Grid
- 2011-10-31 Listed $89,900 MIBOR as Distributed by MLS Grid
- 2011-10-31 Listed $89,900 MIBOR as Distributed by MLS Grid
- 2005-07-20 Sold (MLS) $87,500 MIBOR as Distributed by MLS Grid
- 2005-06-23 Listed $86,900 MIBOR as Distributed by MLS Grid
Property tax history
+9.7%/yrLatest (2024): $769 · +17.0% YoY. Source: county tax records.
Cash-flow waterfall
monthlySold comps — $/sqft
last 12 mo · ≤1 miLoading sold comps…