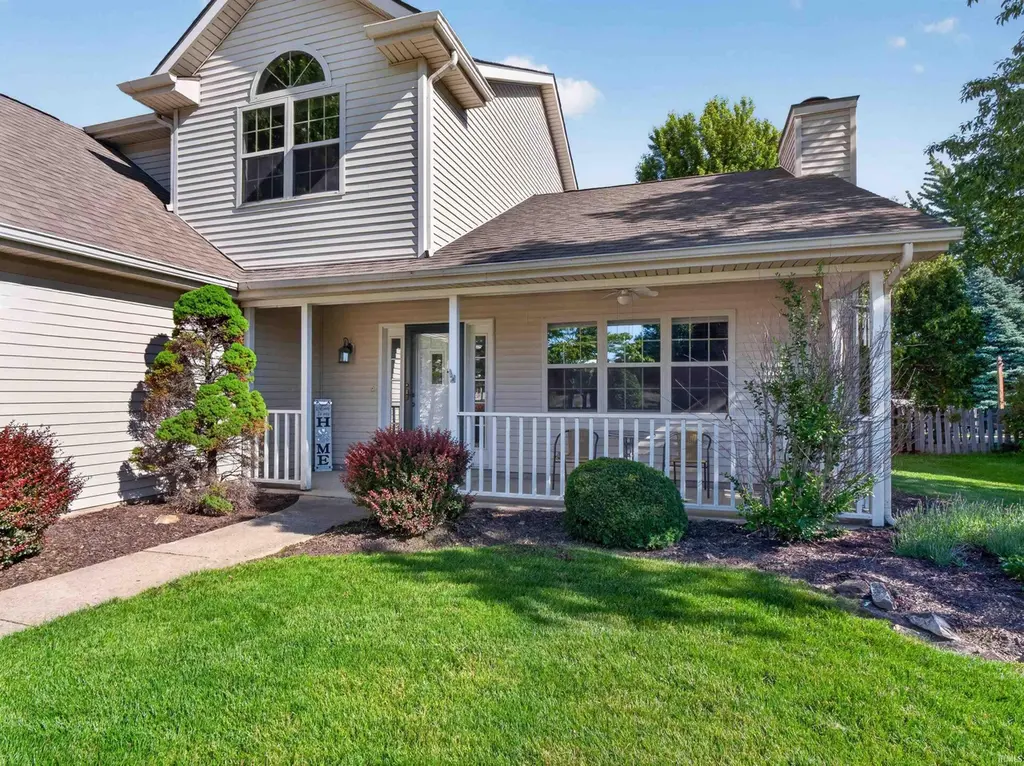
1336 Lost Lock Way
New Haven, IN 46774
$275,000F
3 bd · 2.5 ba ·
1,902 sqft ·
Built 1995
· SingleFamily
· Active
· 23 DOM
Cashflow @ list (25.0% down · 7.5%)
Estimated rent
$2,295/mo
Mortgage (P&I)
−$1,442
Tax + insurance
−$314
HOA
−$5
Vac / Maint / Mgmt
−$482
Net cashflow
$52/mo
Annual
$627/yr
Cap rate
6.52%
Cash-on-cash
0.81%
DSCR
1.04
1% rule
0.83%
Cash to close
$77,000
Investor read
- This is a 3-bed/2.5-bath single-family listed at $275k.
- At list price, monthly cash flow is $52 ($627/yr) — positive.
- The deal already cash-flows at list — no discount required.
- To meet the 1% rule (rent ≥ 1% of price), the offer needs to be $230k (16.5% below list).
- It's been on market 23 days — a 2% lower offer ($271k) is reasonable based on typical stale-listing flexibility.
- Recommended offer: $230k (16.5% below list) — sets the bar for 1% rule.
- Local home prices are declining (-3.0%/yr); year-one equity from $2k of loan paydown is wiped out by about $8k of value loss. Plan a longer hold.
- Location reads 70/100 on livability (#149 in IN) — a middle-class / working-renter tenant base. Strengths: cost of living A+, housing A+, crime B+; Watch: employment D, amenities F, commute F.
- East Allen County Schools (suburban): math 36% / reading 47% proficiency, ranked #122 of 301 in IN (top 40%) — families likely to look elsewhere, expect single-tenant / working-renter base with shorter leases.
- Zoned schools: New Haven Primary School (470 students, 61% FRL); New Haven Jr/Sr High School (math 21% / reading 50%, grade F, #263 of 369 statewide, top 72%, 1,494 students, 67% FRL) — zoned schools average 64% FRL vs 43% district-wide (21 pts higher); higher-poverty schools than district average — tighter screening recommended.
- Market conditions: 180 active listings in the ZIP; 1 comparable units currently listed for rent nearby; 1,861 units permitted in Allen County in 2024 (576 in 5+ unit buildings).
- Allen County population projected at +10% by 2050 — modest demand growth; plan on rents tracking national, not racing it.
- 2 sale attempts since 9y ago with the ask held roughly flat each time — persistent listings suggest the price (not the market) is what's stuck; bring a comps-based counter.
- Current owner paid $140k; list at $275k implies a 96% gain — meaningful room to come down on a strong offer.
- Cap rate 6.5% vs local median 4.8% in New Haven — top-decile yield for the area; either an underpriced asset or a hidden risk that comps aren't pricing in. Stress-test before assuming the spread holds.
Questions for listing agent
- What does the HOA fee cover, when was the last increase, and are there any pending special assessments or reserve-fund shortfalls?
- Is there a deadline driving the sale (1031 exchange, divorce, estate, relocation)? That informs how much negotiation room exists.
- Schools are D-rated, which usually means shorter tenancies and higher turnover. Who's the typical renter profile here, and what's been the actual vacancy rate?
- The area grade is low — what's the realistic commute time and amenity access for the typical tenant pool here? Any planned neighborhood developments (good or bad) we should know about?
- What's the average days-on-market for RENTAL listings here right now (not sales)? A rising rental-DOM trend means longer vacancies and softer asking-rent achievability than the comps imply.
- What's the recent tenant-quality profile in this submarket — average credit score on applications, eviction rate, late-payment / NSF rate, and stable-employment percentage? A property-management company in the area should have these aggregated.
- How much new for-sale + rental construction is in the pipeline within 1–3 miles? Heavy new supply typically softens prices + rents 12–24 months out; constrained supply supports both.
CashFlowRE · CFR-K6YR8S8JQE5GTJ
· Data 21 h ago
cashflowre.app · 2026-05-29