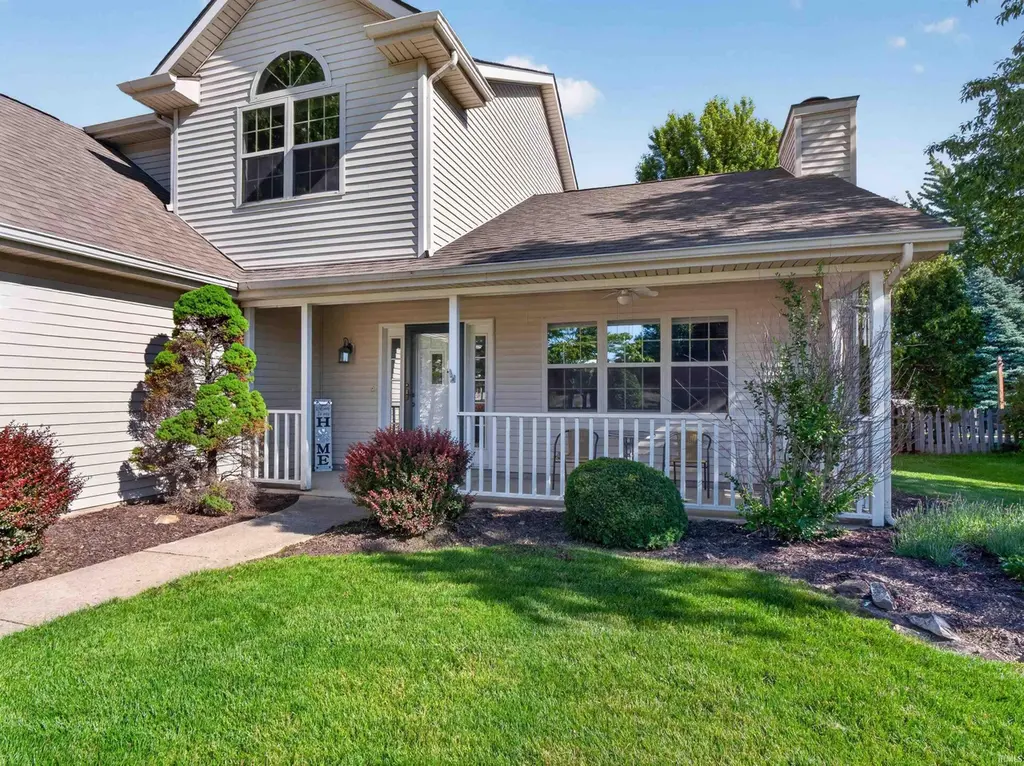
1336 Lost Lock Way · New Haven, IN
Flood risk 1/10 · Minimal
- FEMA flood zone
- X (unshaded)
- Chance of flooding over 30 yrs
- 0.0%
- Est. flood insurance / yr
- $507 – $1,088
Fire risk 1/10 · Minimal
- Est. fire insurance / yr
- $717 – $1,331
Heat risk 3/10 · Minor
- Hot days now (above 100°F)
- 7 days/yr
- Hot days in 30 yrs
- 17 days/yr
Wind risk 2/10 · Minimal
- Chance of severe wind over 30 yrs
- —
Air-quality risk 3/10 · Minor
- Unhealthy air days now
- 3 days/yr
- Unhealthy air days in 30 yrs
- 3 days/yr
Risk factors via First Street. Map © Google.
Why this score? — see what drove the F grade
The composite is a weighted blend of 9 inputs, each scored 0–100. Each bar is that input's sub-score; the figure is the points it added to the 100-point composite (weight × sub-score).
- Cash flow +14.3/30.0
- DSCR +4.4/10.0
- Schools +3.6/10.0
- Livability +3.5/5.0
- 1% rule +3.3/10.0
- Rent growth +2.5/5.0
- Condition / age +2.5/5.0
- ARV discount +0.0/15.0
- Appreciation +0.0/10.0
$275,000
🖨 Deal sheet (PDF) 📄 Offer letter ✓ Due diligence
Listing remarks MLS
Beautiful two-story home in Canal Ridge! This well-maintained home offers 1,900 of living space, 3 bedrooms, 2 full/1 half baths, and separate great & family rooms! Upon entry you will notice the ceramic tiled foyer leading to the large great room complete with elevated ceilings, crown molding, neutral paint, and elegant fireplace! Off the great room is the chef's kitchen, which offers a beautiful breakfast bar to prepare meals, tile floors, backsplash, pantry, built-in desk, spacious nook, and plenty of storage! All appliances stay making this a truly turn-key home! The main floor also offers a family room perfect for gathering with guests, laundry room, half bath, and den/office that could be used as a 4th bedroom! Head upstairs to the spacious master suite with his and her walk-in closets, double sink vanity, neutral paint, and plenty of natural light! Two additional spacious bedrooms and another full bathroom can be found upstairs. Additional features of the home include washer/dryer, ceiling fans, neutral paint throughout, laced ceilings, outdoor play set, and beautiful family room built-ins! Entertain guests during the warm summer months with BBQs in your spacious, fenced-in yard while guests enjoy the included play set and fire pit! Your new home has arrived and is waiting for you!
Key facts
- Bright kitchen
- Master suite
- Flex space
Tags
Property features AI
Finance
- HOA & community: Homeowners association with an annual fee of $65 (about $5.42/month); No association amenities listed
Exterior
- Parking: Attached concrete garage with 2 spaces
- Security: Smoke detectors
- Utilities: Public water; Public sewer
- Home design: Single-family residence (site-built); Two stories; Slab foundation
- Construction: Brick and vinyl siding exterior; Shingle roof; Built as a site-built home
- Exterior features: Wood fencing; Corner lot; Level lot; Landscaped yard
Interior
- Kitchen: Disposal; Dishwasher; Microwave; Refrigerator; Electric cooktop; Electric oven
- Flooring: Carpet; Tile; Vinyl
- Bathrooms: Two full bathrooms; One half bathroom; One main-level bathroom
- Heating & cooling: Natural gas heating with forced air; Central air conditioning
- Interior features: Vaulted ceilings; Fireplace in the family room
- Laundry & utility: Washer included; Dryer included; Electric dryer hookup on the main level
Neighborhood map
What this means for you Summary
Snapshot
- This is a 3-bed/2.5-bath single-family listed at $275k.
Deal economics
- At list price, monthly cash flow is $52 ($627/yr) — positive.
- The deal already cash-flows at list — no discount required.
- To meet the 1% rule (rent ≥ 1% of price), the offer needs to be $230k (16.5% below list).
- Recommended offer: $230k (16.5% below list) — sets the bar for 1% rule.
- Cap rate 6.5% vs local median 4.8% in New Haven — top-decile yield for the area; either an underpriced asset or a hidden risk that comps aren't pricing in. Stress-test before assuming the spread holds.
Location & tenants
- Location reads 70/100 on livability (#149 in IN) — a middle-class / working-renter tenant base. Strengths: cost of living A+, housing A+, crime B+; Watch: employment D, amenities F, commute F.
- East Allen County Schools (suburban): math 36% / reading 47% proficiency, ranked #122 of 301 in IN (top 40%) — families likely to look elsewhere, expect single-tenant / working-renter base with shorter leases.
- Zoned schools: New Haven Primary School (470 students, 61% FRL); New Haven Jr/Sr High School (math 21% / reading 50%, grade F, #263 of 369 statewide, top 72%, 1,494 students, 67% FRL) — zoned schools average 64% FRL vs 43% district-wide (21 pts higher); higher-poverty schools than district average — tighter screening recommended.
- Market conditions: 180 active listings in the ZIP; 1 comparable units currently listed for rent nearby; 1,861 units permitted in Allen County in 2024 (576 in 5+ unit buildings).
Forward outlook
- Local home prices are declining (-3.0%/yr); year-one equity from $2k of loan paydown is wiped out by about $8k of value loss. Plan a longer hold.
- Allen County population projected at +10% by 2050 — modest demand growth; plan on rents tracking national, not racing it.
Negotiation context
- It's been on market 23 days — a 2% lower offer ($271k) is reasonable based on typical stale-listing flexibility.
- 2 sale attempts since 9y ago with the ask held roughly flat each time — persistent listings suggest the price (not the market) is what's stuck; bring a comps-based counter.
- Current owner paid $140k; list at $275k implies a 96% gain — meaningful room to come down on a strong offer.
Questions for the listing agent
- What does the HOA fee cover, when was the last increase, and are there any pending special assessments or reserve-fund shortfalls?
- Is there a deadline driving the sale (1031 exchange, divorce, estate, relocation)? That informs how much negotiation room exists.
- Schools are D-rated, which usually means shorter tenancies and higher turnover. Who's the typical renter profile here, and what's been the actual vacancy rate?
- The area grade is low — what's the realistic commute time and amenity access for the typical tenant pool here? Any planned neighborhood developments (good or bad) we should know about?
- What's the average days-on-market for RENTAL listings here right now (not sales)? A rising rental-DOM trend means longer vacancies and softer asking-rent achievability than the comps imply.
- What's the recent tenant-quality profile in this submarket — average credit score on applications, eviction rate, late-payment / NSF rate, and stable-employment percentage? A property-management company in the area should have these aggregated.
- How much new for-sale + rental construction is in the pipeline within 1–3 miles? Heavy new supply typically softens prices + rents 12–24 months out; constrained supply supports both.
Investment metrics
- 1% rule
- 0.83% ✗
- Cap rate
- 6.52%
- Cash-on-cash
- 0.81%
- DSCR
- 1.04
- GRM
- 10.0
CMA / ARV
- ARV (on-the-fly)
- $226,338
- Comps found
- 12
Show comp detail 12 sales within ~0.75 mi
| Address | Dist | Beds/Ba | Sqft | Sold | Price | $/sf | Match |
|---|---|---|---|---|---|---|---|
| 1231 Lost Lock Way | 0.09mi | 4/2.5 (+1) | 1,930 (+2%) | 3mo | $250,000 | $130 | 86 |
| 1709 N Tyland Blvd | 0.33mi | 3/2.0 | 1,920 (+1%) | 3mo | $158,000 | $82 | 78 |
| 1706 N Tyland Blvd | 0.31mi | 3/2.0 | 1,800 (-5%) | 2mo | $220,000 | $122 | 73 |
| 10805 E Lincoln Hwy | 0.33mi | 3/2.0 | 1,868 (-2%) | 10mo | $215,000 | $115 | 72 |
| 1728 N Tyland Blvd | 0.28mi | 3/2.0 | 1,983 (+4%) | 8mo | $253,000 | $128 | 71 |
| 10804 Keelboat Cv | 0.12mi | 3/2.5 | 1,756 (-8%) | 20mo | $255,000 | $145 | 65 |
| 348 W Tyland Blvd | 0.34mi | 3/2.0 | 1,660 (-13%) | 5mo | $219,900 | $132 | 57 |
| 1234 Summit St | 0.59mi | 4/2.0 (+1) | 1,971 (+4%) | 10mo | $210,000 | $107 | 50 |
| 332 W Tyland Blvd | 0.34mi | 4/1.5 (+1) | 1,680 (-12%) | 11mo | $200,000 | $119 | 46 |
| 308 Tylar Pkwy | 0.23mi | 4/1.5 (+1) | 1,638 (-14%) | 14mo | $192,500 | $118 | 46 |
| 1123 Highland Terrace Dr | 0.75mi | 3/2.0 | 1,988 (+4%) | 16mo | $142,000 | $71 | 42 |
| 1201 Canal St | 0.62mi | 3/1.5 | 1,646 (-14%) | 9mo | $178,000 | $108 | 37 |
Match score weights: distance 35% · size 25% · config 20% · recency 20%. Top-matched comps best support the ARV.
Projected returns pro-forma
-3.0% appreciation · 3.0% rent growth · sell at horizon
- IRR
- -15.0%
- Equity multiple
- 0.46×
- Total profit
- $-41,285
- Equity at exit
- $41,003
- IRR
- -6.5%
- Equity multiple
- 0.59×
- Total profit
- $-31,873
- Equity at exit
- $23,777
Cash invested: $77,000 (down + closing). Projections, not guarantees.
Landlord ↔ Tenant lean methodology
- Overall (STATE)
- 90 Strongly Landlord-Friendly
- State Indiana
- 90 Strongly Landlord-Friendly · R+11
- County
- — inherits STATE
- City
- — inherits STATE
ZIP-level market 46774
- Active inventory
- 180
- Price-to-rent
- 10.0×
Monthly cashflow live
- Estimated rent
- $2,295 medium interval (Pro) →
- Mortgage (P&I)
- −$1,442
- Tax from tax record
- −$199 /mo · $2,389/yr
- Insurance
- −$115
- HOA
- −$5
- Vacancy / Maint / Mgmt
- −$482
- Net cashflow
- $52
Break-even live
Sensitivity live
| Price | -10% $208 | -5% $130 | +0% $52 | +5% $-26 | +10% $-103 |
|---|---|---|---|---|---|
| Rent | -10% $-129 | -5% $-38 | +0% $52 | +5% $143 | +10% $234 |
| Rate | -1.0pp $191 | -0.5pp $122 | base $52 | +0.5pp $-19 | +1.0pp $-92 |
UW: 25.0% down · 7.5% · 30yr · 1.5% tax · 5.0% vac · 8.0% maint · 8.0% mgmt
Financing live
Cash to close
- Down payment
- $68,750
- Closing costs
- $8,250
- Reserves months
- —
- Total cash needed
- —
Loan-product check · same deal, 3 products live
Conventional
25% down · 7.5% · 30yr
- Down + closing
- —
- Monthly P&I
- —
- Monthly cashflow
- —
- DSCR
- —
- Eligible?
- —
Personal DTI + credit; lowest rate.
DSCR
20% down · 8.5% · 30yr
- Down + closing
- —
- Monthly P&I
- —
- Monthly cashflow
- —
- DSCR
- —
- Eligible?
- —
No personal income docs; deal must DSCR.
Hard money
10% down · 12.0% · 12mo
- Down + closing
- —
- Monthly P&I
- —
- Monthly cashflow
- —
- DSCR
- —
- Eligible?
- —
Short-term bridge; refi at stabilization.
Rent comps 1 comps
| Address | Beds | Baths | Sqft | Rent | $/sqft | DOM | Units | Dist |
|---|---|---|---|---|---|---|---|---|
| 3599 Canal Square Dr New Haven, IN | 3.0 | 2.5 | 1832 | $2,295 | $1.25 | 23d | 1 | 1.49mi |
HOA detail
- Monthly dues
- $5 · $60/yr
Listing history 17 events
-
2026-06-21days on market $275,000 Active 23 DOM
-
2026-06-18days on market $275,000 Active 20 DOM
-
2026-06-17days on market $275,000 Active 19 DOM
-
2026-06-16days on market $275,000 Active 18 DOM
-
2026-06-15days on market $275,000 Active 17 DOM
-
2026-06-14days on market $275,000 Active 15 DOM
-
2026-06-13pricedays on market $275,000 Active 14 DOM
-
2026-06-10days on market $280,000 Active 12 DOM
-
2026-06-09days on market $280,000 Active 11 DOM
-
2026-06-08days on market $280,000 Active 10 DOM
-
2026-06-07days on market $280,000 Active 9 DOM
-
2026-06-03days on market $280,000 Active 5 DOM
-
2026-06-02days on market $280,000 Active 4 DOM
-
2026-06-01days on market $280,000 Active 3 DOM
-
2026-05-31days on market $280,000 Active 2 DOM
-
2026-05-30remarks 699-char remark
-
2026-05-30$280,000 Active 1 DOM
ⓘ Source: listings_history table (triggers on properties + properties_extension) + one-shot
backfill from property_details.listing_events for pre-trigger history.
Tax reassessment forecast IN · Partial reset (capped growth)
- Current annual tax
- $2,389 · $199/mo
- Projected year-2 tax
- $2,389 · $199/mo
- Expected delta
- $0/yr ($0/mo · 0.0%)
ⓘ Screening estimate from a state-policy table — verify with the county assessor before closing.
Climate risk First Street
- Flood 1/10 Low FEMA zone X (unshaded) · 0% chance over 30 yrs
- Wildfire 1/10 Low
- Heat 3/10 Moderate 7 d/yr ≥100°F today · 17 d/yr by 30 yrs out
- Wind 2/10 Low
- Air quality 3/10 Moderate 3 unhealthy d/yr today · 3 by 30 yrs out
Nearby sold comps map
Loading sold comps map…
Walkable amenities ~0.75 mi
Loading nearby amenities…
Taxation est. · year 1
- Rental income
- $27,540
- − Mortgage interest
- −$15,404
- − Property taxes
- −$2,389
- − Insurance
- −$1,375
- − Repairs & maintenance
- −$2,203
- − Management
- −$2,203
- − HOA
- −$60
- − Depreciation
- −$8,000
- Taxable loss
- −$4,095
- Est. tax savings @ 24.0%
- +$983
- After-tax cash flow
- $1,610/yr
For passive investors: Depreciation is non-cash, so a rental often shows a tax loss while cash-flowing — sheltering income. Rental losses are passive: they offset passive income freely, and up to $25,000/yr can offset ordinary (W-2) income if you actively participate and your MAGI is under $100k (phasing out to $0 by $150k); unused losses carry forward. On sale, claimed depreciation is recaptured at up to 25%, and gains may owe capital-gains tax (a 1031 exchange can defer both). Figures are a year-1 estimate at your 24.0% rate — not tax advice; consult a CPA.
Schools (NCES district)
- District
- East Allen County Schools
- NCES district ID
- 1802850
- Math proficiency
- 36% ▼ -8.00%
- Reading proficiency
- 47% ▼ -4.00%
- Median HH income
- $50,524
- Composite
- 35.75/100
- National rank
- #4849
- State rank
- #122 of 301 in IN
Livability — New Haven
- Score
- 70/100
- State rank
- #149
- US rank
- #7499
Category grades
Schools grade is shown separately in the Schools card above.
Census & demographics
- Census place
- New Haven, IN
- Population (ZIP)
- 17,066
Population outlook (Allen County) Hauer SSP2
- Today (2025)
- 394,020 people
- By 2030
- 405,128 · +2.8%
- By 2040
- 423,476 · +7.5%
- By 2050
- 435,137 · +10.4%
- By 2075
- 450,293 · +14.3%
- By 2100
- 424,101 · +7.6%
Race, ethnicity, and origin ACS 2023
- Neighborhood character
- Predominantly White (89%)
- Race & ethnicity
- White 89% Two or more races 4% Hispanic / Latino 4% Black 3% Asian 1%
- Common ancestry
- Lithuanian 5% Italian 2% Slovak 1%
- Foreign-born
- 3% · Canada, Philippines
- Languages at home
- 89% English-only · German/W. Germanic 6% Spanish 3% Chinese 1%
Political lean MEDSL · Allen
- 2024 margin
- R (+12.5) · D 42.9% · R 55.4% · Other 1.7%
- 2008→2024 swing
- -8.1pp toward R · 2008: -4.3pp · 2024: -12.5pp
- All cycles
- 2024: R+12.5 2020: R+11.2 2016: R+19.6 2012: R+16.8 2008: R+4.3
Not yet ingested
- Civics
- —
Market trends
- HPI YoY
- ▼ -185.27%
- Current HPI
- 241.5333
- Rent YoY
- —
- Metro
- —
- State GDP YoY
- ▲ 2.90%
- F500 in state
- 18
Industry mix (Fortune 500 HQ in IN)
| Industry | F500 HQs | Revenue |
|---|---|---|
| Industrial Machinery | 2 | $37B |
|
||
| Healthcare | 1 | $177B |
|
||
| Pharmaceuticals | 1 | $45B |
|
||
| Metals / Steel | 1 | $18B |
|
||
| Agriculture | 1 | $17B |
|
||
| Packaging | 1 | $12B |
|
||
Price history
+93.2% since first listed3 events — show timeline
- 2026-05-29 Listed $280,000 IRMLS
- 2017-09-15 Sold (MLS) $140,000 IRMLS
- 2017-07-18 Listed $144,900 IRMLS
Property tax history
+3.4%/yrLatest (2024): $2,389 · +5.5% YoY. Source: county tax records.
Cash-flow waterfall
monthlySold comps — $/sqft
last 12 mo · ≤1 miLoading sold comps…