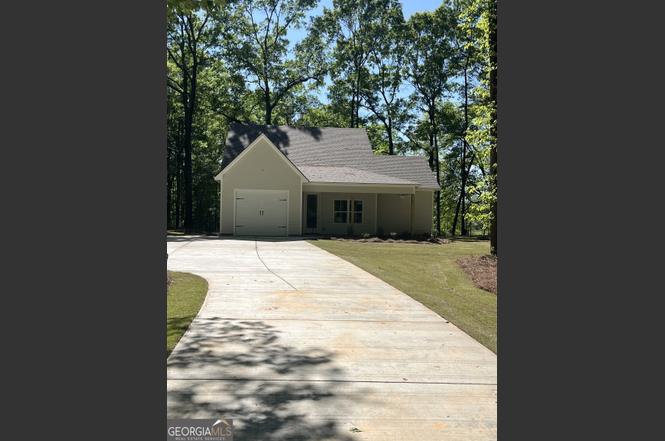
263 Waverly Cir
Waverly Hall, GA 31831
$310,000D
3 bd · 2.0 ba ·
1,403 sqft ·
Built 2026
· SingleFamily
· Under Contract
· 46 DOM
Cashflow @ list (25.0% down · 7.5%)
Estimated rent
$2,401/mo
Mortgage (P&I)
−$1,597
Tax + insurance
−$507
HOA
−$0
Vac / Maint / Mgmt
−$504
Net cashflow
$-207/mo
Annual
$-2,489/yr
Cap rate
5.48%
Cash-on-cash
-2.92%
DSCR
0.87
1% rule
0.79%
Cash to close
$85,246
Investor read
- This is a 3-bed/2.0-bath single-family listed at $310k.
- At list price, monthly cash flow is $-207 ($-2k/yr) — negative.
- To cash-flow at today's rent, offer at most $274k (11.5% below list).
- To meet the 1% rule (rent ≥ 1% of price), the offer needs to be $240k (22.6% below list).
- It's been on market 46 days — a 3% lower offer ($301k) is reasonable based on typical stale-listing flexibility.
- Recommended offer: $240k (22.6% below list) — sets the bar for 1% rule.
- In year one you build about $9k of equity ($2k loan paydown + $7k appreciation (2.2% local appreciation)).
- Location reads 61/100 on livability (#346 in GA) — a middle-class / working-renter tenant base. Strengths: cost of living A+, housing A+; Watch: crime D+, amenities F, commute F.
- Harris County (rural): math 41% / reading 43% proficiency, ranked #27 of 174 in GA (top 16%) — families likely to look elsewhere, expect single-tenant / working-renter base with shorter leases.
- Zoned schools: Pine Ridge Elementary School (math 40% / reading 41%, grade F, #419 of 1,228 statewide, top 35%, 639 students, 30% FRL); Creekside School (math 39% / reading 43%, grade F, #135 of 470 statewide, top 29%, 858 students, 30% FRL); Harris County High School (math 30% / reading 39%, grade F, #88 of 424 statewide, top 22%, 1,703 students, 25% FRL) — zoned schools at 28% FRL track the district average.
- Market conditions: 103 active listings in the ZIP; 189 units permitted in Harris County in 2024 (0 in 5+ unit buildings).
- Harris County population projected at +9% by 2050 — modest demand growth; plan on rents tracking national, not racing it.
- 2 sale attempts with the ask held roughly flat each time — persistent listings suggest the price (not the market) is what's stuck; bring a comps-based counter.
- By year 4, paydown + projected appreciation supports a ~$30k cash-out refi (75% LTV) — recoverable capital for the next deal without selling this one.
- Cap rate 5.5% vs local median 3.8% in Waverly Hall — top-decile yield for the area; either an underpriced asset or a hidden risk that comps aren't pricing in. Stress-test before assuming the spread holds.
Questions for listing agent
- What do current leases actually rent for vs. the listed asking? Can we see a recent rent roll and the last 12 months of T-12 income?
- It's been on market 46 days. Have you received any prior offers? Is the seller open to a 23% concession, seller financing, or rate buy-down credit?
- Is there a deadline driving the sale (1031 exchange, divorce, estate, relocation)? That informs how much negotiation room exists.
- Schools are D-rated, which usually means shorter tenancies and higher turnover. Who's the typical renter profile here, and what's been the actual vacancy rate?
- Crime grade is D in this area — have there been break-ins, vandalism, or insurance claims at this property in the last 3 years? What carrier currently insures it and at what premium?
- The area grade is low — what's the realistic commute time and amenity access for the typical tenant pool here? Any planned neighborhood developments (good or bad) we should know about?
- What's the average days-on-market for RENTAL listings here right now (not sales)? A rising rental-DOM trend means longer vacancies and softer asking-rent achievability than the comps imply.
- What's the recent tenant-quality profile in this submarket — average credit score on applications, eviction rate, late-payment / NSF rate, and stable-employment percentage? A property-management company in the area should have these aggregated.
CashFlowRE · CFR-K7T69F3G586PNP
· Data 4 weeks ago
cashflowre.app · 2026-05-29