 🏗️ New Construction
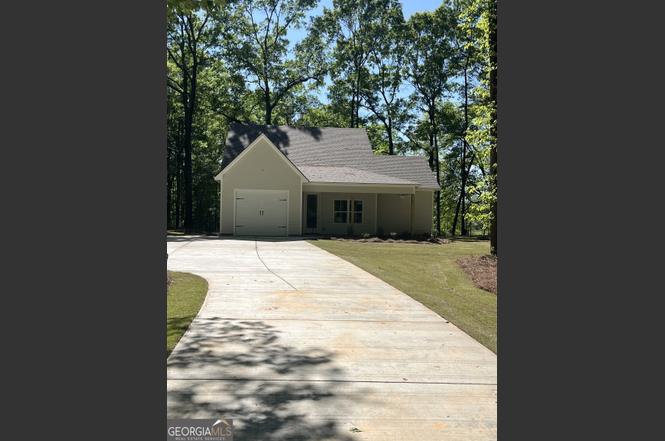
263 Waverly Cir · Waverly Hall, GA
Flood risk No data
- FEMA flood zone
- —
- Chance of flooding over 30 yrs
- —
- Est. flood insurance / yr
- —
Fire risk No data
- Est. fire insurance / yr
- —
Heat risk No data
- Hot days now (above threshold)
- —
- Hot days in 30 yrs
- —
Wind risk No data
- Chance of severe wind over 30 yrs
- —
Air-quality risk No data
- Unhealthy air days now
- —
- Unhealthy air days in 30 yrs
- —
Risk factors via First Street. Map © Google.
Why this score? — see what drove the D grade
The composite is a weighted blend of 9 inputs, each scored 0–100. Each bar is that input's sub-score; the figure is the points it added to the 100-point composite (weight × sub-score).
- Cash flow +9.6/30.0
- ARV discount +7.5/15.0
- Appreciation +6.1/10.0
- Schools +3.8/10.0
- Livability +3.1/5.0
- 1% rule +2.9/10.0
- DSCR +2.7/10.0
- Rent growth +2.5/5.0
- Condition / age +2.5/5.0
$310,000
🖨 Deal sheet (PDF) 📄 Offer letter ✓ Due diligence
Listing remarks MLS
Welcome to this brand-new 3-bedroom, 2-bath home that offers 1,403 sq ft of comfortable, easy living space with a great open layout. With 1.19 acres to call your own, there's plenty of space to relax, garden, or just enjoy a little extra breathing room while settling into a home that's ready for its very first owners.
Key facts
- Open layout
- 1.19 acres
- 1.19 acre lot
Tags
Property features AI
Finance
- Other: Home warranty included
- HOA & community: No HOA
Exterior
- Parking: Attached garage; Garage with parking pad; Open parking
- Utilities: Public water available; Septic sewer; Electricity available
- Home design: Single-family residence (house); New construction; One level
- Construction: Built in 2026; Concrete construction; Other roof
- Exterior features: Level lot
Interior
- Kitchen: Dishwasher; Microwave; Refrigerator; Stainless steel appliances
- Bedrooms: 3 bedrooms on the main level
- Flooring: Laminate
- Bathrooms: 2 full bathrooms (both on the main level)
- Heating & cooling: Electric heating; Electric cooling; Ceiling fan(s)
- Interior features: Double vanity; Separate shower; Walk-in closet(s); Family room
- Laundry & utility: Laundry in hall
Neighborhood map
What this means for you Summary
Snapshot
- This is a 3-bed/2.0-bath single-family listed at $310k.
Deal economics
- At list price, monthly cash flow is $-207 ($-2k/yr) — negative.
- To cash-flow at today's rent, offer at most $274k (11.5% below list).
- To meet the 1% rule (rent ≥ 1% of price), the offer needs to be $240k (22.6% below list).
- Recommended offer: $240k (22.6% below list) — sets the bar for 1% rule.
- Cap rate 5.5% vs local median 3.8% in Waverly Hall — top-decile yield for the area; either an underpriced asset or a hidden risk that comps aren't pricing in. Stress-test before assuming the spread holds.
Location & tenants
- Location reads 61/100 on livability (#346 in GA) — a middle-class / working-renter tenant base. Strengths: cost of living A+, housing A+; Watch: crime D+, amenities F, commute F.
- Harris County (rural): math 41% / reading 43% proficiency, ranked #27 of 174 in GA (top 16%) — families likely to look elsewhere, expect single-tenant / working-renter base with shorter leases.
- Zoned schools: Pine Ridge Elementary School (math 40% / reading 41%, grade F, #419 of 1,228 statewide, top 35%, 639 students, 30% FRL); Creekside School (math 39% / reading 43%, grade F, #135 of 470 statewide, top 29%, 858 students, 30% FRL); Harris County High School (math 30% / reading 39%, grade F, #88 of 424 statewide, top 22%, 1,703 students, 25% FRL) — zoned schools at 28% FRL track the district average.
- Market conditions: 103 active listings in the ZIP; 189 units permitted in Harris County in 2024 (0 in 5+ unit buildings).
Forward outlook
- In year one you build about $9k of equity ($2k loan paydown + $7k appreciation (2.2% local appreciation)).
- Harris County population projected at +9% by 2050 — modest demand growth; plan on rents tracking national, not racing it.
- By year 4, paydown + projected appreciation supports a ~$30k cash-out refi (75% LTV) — recoverable capital for the next deal without selling this one.
Negotiation context
- It's been on market 46 days — a 3% lower offer ($301k) is reasonable based on typical stale-listing flexibility.
- 2 sale attempts with the ask held roughly flat each time — persistent listings suggest the price (not the market) is what's stuck; bring a comps-based counter.
Questions for the listing agent
- What do current leases actually rent for vs. the listed asking? Can we see a recent rent roll and the last 12 months of T-12 income?
- It's been on market 46 days. Have you received any prior offers? Is the seller open to a 23% concession, seller financing, or rate buy-down credit?
- Is there a deadline driving the sale (1031 exchange, divorce, estate, relocation)? That informs how much negotiation room exists.
- Schools are D-rated, which usually means shorter tenancies and higher turnover. Who's the typical renter profile here, and what's been the actual vacancy rate?
- Crime grade is D in this area — have there been break-ins, vandalism, or insurance claims at this property in the last 3 years? What carrier currently insures it and at what premium?
- The area grade is low — what's the realistic commute time and amenity access for the typical tenant pool here? Any planned neighborhood developments (good or bad) we should know about?
- What's the average days-on-market for RENTAL listings here right now (not sales)? A rising rental-DOM trend means longer vacancies and softer asking-rent achievability than the comps imply.
- What's the recent tenant-quality profile in this submarket — average credit score on applications, eviction rate, late-payment / NSF rate, and stable-employment percentage? A property-management company in the area should have these aggregated.
- How much new for-sale + rental construction is in the pipeline within 1–3 miles? Heavy new supply typically softens prices + rents 12–24 months out; constrained supply supports both.
Investment metrics
- 1% rule
- 0.79% ✗
- Cap rate
- 5.48%
- Cash-on-cash
- -2.92%
- DSCR
- 0.87
- GRM
- 10.6
CMA / ARV
- ARV (on-the-fly)
- $304,451
- Comps found
- 2
Show comp detail 2 sales within ~0.75 mi
| Address | Dist | Beds/Ba | Sqft | Sold | Price | $/sf | Match |
|---|---|---|---|---|---|---|---|
| 263 Waverly Cir | 0.00mi | 3/2.0 | 1,403 (0%) | 1mo | $305,000 | $217 | 99 |
| 187 Waverly Cir | 0.11mi | 3/2.0 | 1,530 (+9%) | 10mo | $271,100 | $177 | 71 |
Match score weights: distance 35% · size 25% · config 20% · recency 20%. Top-matched comps best support the ARV.
Projected returns pro-forma
2.19% appreciation · 3.0% rent growth · sell at horizon
- IRR
- 2.3%
- Equity multiple
- 1.12×
- Total profit
- $10,602
- Equity at exit
- $123,170
- IRR
- 6.1%
- Equity multiple
- 1.86×
- Total profit
- $72,946
- Equity at exit
- $179,769
Cash invested: $85,246 (down + closing). Projections, not guarantees.
Landlord ↔ Tenant lean methodology
- Overall (STATE)
- 90 Strongly Landlord-Friendly
- State Georgia
- 90 Strongly Landlord-Friendly · R+3
- County
- — inherits STATE
- City
- — inherits STATE
ZIP-level market 31831
- Home prices YoY
- 1.1%
- Active inventory
- 103
- Price-to-rent
- 10.8×
Monthly cashflow live
- Estimated rent
- $2,401 medium interval (Pro) →
- Mortgage (P&I)
- −$1,597
- Tax est. 1.5%
- −$381 /mo · $4,567/yr
- Insurance
- −$127
- HOA
- −$0
- Vacancy / Maint / Mgmt
- −$504
- Net cashflow
- $-207
Break-even live
Sensitivity live
| Price | -10% $3 | -5% $-102 | +0% $-207 | +5% $-313 | +10% $-418 |
|---|---|---|---|---|---|
| Rent | -10% $-397 | -5% $-302 | +0% $-207 | +5% $-113 | +10% $-18 |
| Rate | -1.0pp $-54 | -0.5pp $-130 | base $-207 | +0.5pp $-286 | +1.0pp $-367 |
UW: 25.0% down · 7.5% · 30yr · 1.5% tax · 5.0% vac · 8.0% maint · 8.0% mgmt
Financing live
Cash to close
- Down payment
- $76,113
- Closing costs
- $9,134
- Reserves months
- —
- Total cash needed
- —
Loan-product check · same deal, 3 products live
Conventional
25% down · 7.5% · 30yr
- Down + closing
- —
- Monthly P&I
- —
- Monthly cashflow
- —
- DSCR
- —
- Eligible?
- —
Personal DTI + credit; lowest rate.
DSCR
20% down · 8.5% · 30yr
- Down + closing
- —
- Monthly P&I
- —
- Monthly cashflow
- —
- DSCR
- —
- Eligible?
- —
No personal income docs; deal must DSCR.
Hard money
10% down · 12.0% · 12mo
- Down + closing
- —
- Monthly P&I
- —
- Monthly cashflow
- —
- DSCR
- —
- Eligible?
- —
Short-term bridge; refi at stabilization.
Listing history 4 events
-
2026-04-18status Under Contract
Show marketing remark (319 chars)
Welcome to this brand-new 3-bedroom, 2-bath home that offers 1,403 sq ft of comfortable, easy living space with a great open layout. With 1.19 acres to call your own, there's plenty of space to relax, garden, or just enjoy a little extra breathing room while settling into a home that's ready for its very first owners.
-
2026-04-18status Pending 319-char remark
Show marketing remark (319 chars)
Welcome to this brand-new 3-bedroom, 2-bath home that offers 1,403 sq ft of comfortable, easy living space with a great open layout. With 1.19 acres to call your own, there's plenty of space to relax, garden, or just enjoy a little extra breathing room while settling into a home that's ready for its very first owners.
-
2026-03-03$310,000 New
Show marketing remark (319 chars)
Welcome to this brand-new 3-bedroom, 2-bath home that offers 1,403 sq ft of comfortable, easy living space with a great open layout. With 1.19 acres to call your own, there's plenty of space to relax, garden, or just enjoy a little extra breathing room while settling into a home that's ready for its very first owners.
-
2026-03-03$310,000 Active 319-char remark
Show marketing remark (319 chars)
Welcome to this brand-new 3-bedroom, 2-bath home that offers 1,403 sq ft of comfortable, easy living space with a great open layout. With 1.19 acres to call your own, there's plenty of space to relax, garden, or just enjoy a little extra breathing room while settling into a home that's ready for its very first owners.
ⓘ Source: listings_history table (triggers on properties + properties_extension) + one-shot
backfill from property_details.listing_events for pre-trigger history.
Nearby sold comps map
Loading sold comps map…
Walkable amenities ~0.75 mi
Loading nearby amenities…
Taxation est. · year 1
- Rental income
- $28,809
- − Mortgage interest
- −$17,054
- − Property taxes
- −$4,567
- − Insurance
- −$1,522
- − Repairs & maintenance
- −$2,305
- − Management
- −$2,305
- − Depreciation
- −$8,857
- Taxable loss
- −$7,800
- Est. tax savings @ 24.0%
- +$1,872
- After-tax cash flow
- $-617/yr
For passive investors: Depreciation is non-cash, so a rental often shows a tax loss while cash-flowing — sheltering income. Rental losses are passive: they offset passive income freely, and up to $25,000/yr can offset ordinary (W-2) income if you actively participate and your MAGI is under $100k (phasing out to $0 by $150k); unused losses carry forward. On sale, claimed depreciation is recaptured at up to 25%, and gains may owe capital-gains tax (a 1031 exchange can defer both). Figures are a year-1 estimate at your 24.0% rate — not tax advice; consult a CPA.
Schools (NCES district)
- District
- Harris County
- NCES district ID
- 1302700
- Math proficiency
- 41% ▼ -10.00%
- Reading proficiency
- 43% ▼ -9.00%
- Median HH income
- $66,705
- Composite
- 37.75/100
- National rank
- #4350
- State rank
- #27 of 174 in GA
Livability — Waverly Hall
- Score
- 61/100
- State rank
- #346
- US rank
- #17925
Category grades
Schools grade is shown separately in the Schools card above.
Census & demographics
- Census place
- Waverly Hall, GA
- Population (ZIP)
- 3,709
Population outlook (Harris County) Hauer SSP2
- Today (2025)
- 35,683 people
- By 2030
- 36,673 · +2.8%
- By 2040
- 38,038 · +6.6%
- By 2050
- 38,782 · +8.7%
- By 2075
- 41,279 · +15.7%
- By 2100
- 41,103 · +15.2%
Race, ethnicity, and origin ACS 2023
- Neighborhood character
- Predominantly White (78%)
- Race & ethnicity
- White 78% Black 14% Two or more races 5% Hispanic / Latino 3%
- Common ancestry
- Iranian 4% Lithuanian 2% Slovak 2%
- Foreign-born
- 1% · South Korea
- Languages at home
- 97% English-only · Spanish 2%
Political lean MEDSL · Harris
- 2024 margin
- Solid R (+46.1) · D 26.7% · R 72.8%
- 2008→2024 swing
- -2.8pp toward R · 2008: -43.4pp · 2024: -46.1pp
- All cycles
- 2024: R+46.1 2020: R+44.3 2016: R+47.9 2012: R+45.6 2008: R+43.4
Not yet ingested
- Civics
- —
Market trends
- HPI YoY
- ▲ 2.19%
- Current HPI
- 205.1007
- Rent YoY
- —
- Metro
- —
- State GDP YoY
- ▲ 2.66%
- F500 in state
- 28
Industry mix (Fortune 500 HQ in GA)
| Industry | F500 HQs | Revenue |
|---|---|---|
| Paper / Packaging | 2 | $29B |
|
||
| Retail | 1 | $160B |
|
||
| Transportation / Logistics | 1 | $91B |
|
||
| Airlines | 1 | $62B |
|
||
| Consumer Goods | 1 | $47B |
|
||
| Utilities | 1 | $25B |
|
||
Price history
+0.0% since first listed4 events — show timeline
- 2026-04-18 Pending — GAMLS
- 2026-04-18 Pending — CBOR
- 2026-03-03 Listed $310,000 CBOR
- 2026-03-03 Listed $310,000 GAMLS
Cash-flow waterfall
monthlySold comps — $/sqft
last 12 mo · ≤1 miLoading sold comps…