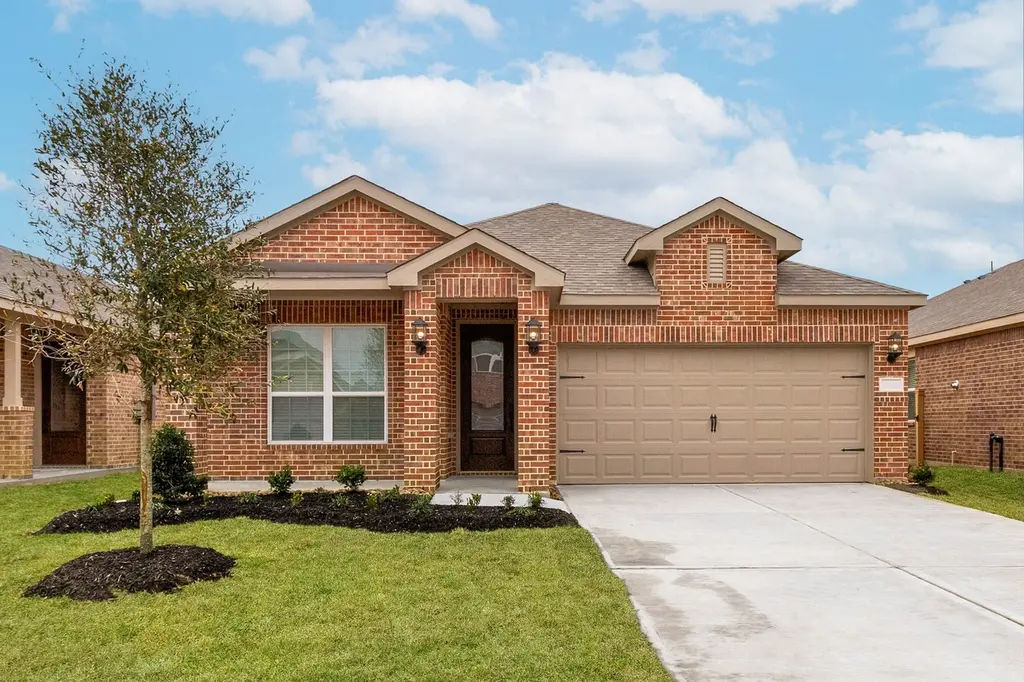
1111 Campside Dr
Rosenberg, TX 77417
$312,900D+
3 bd · 2.0 ba ·
1,613 sqft ·
Built 2026
· Land
· Active
· 11 DOM
Cashflow @ list (25.0% down · 7.5%)
Estimated rent
$2,375/mo
Mortgage (P&I)
−$1,506
Tax + insurance
−$250
HOA
−$140
Vac / Maint / Mgmt
−$499
Net cashflow
$-19/mo
Annual
$-230/yr
Cap rate
6.21%
Cash-on-cash
-0.29%
DSCR
0.99
1% rule
0.83%
Cash to close
$80,400
Investor read
- This is a 3-bed/2.0-bath land listed at $313k.
- At list price, monthly cash flow is $-19 ($-230/yr) — negative.
- To cash-flow at today's rent, offer at most $284k (9.3% below list).
- To meet the 1% rule (rent ≥ 1% of price), the offer needs to be $238k (24.1% below list).
- Only 11 days on market — expect competitive offers; lowballing is unlikely to land.
- Recommended offer: $238k (24.1% below list) — sets the bar for 1% rule.
- In year one you build about $14k of equity ($2k loan paydown + $12k appreciation (4.2% local appreciation)).
- Location reads 62/100 on livability (#922 in TX) — a middle-class / working-renter tenant base. Strengths: cost of living A+, housing A+, crime B; Watch: amenities F, commute F, health & safety F.
- Lamar CISD (suburban): math 50% / reading 53% proficiency, ranked #116 of 826 in TX (top 14%) — acceptable for families but not a draw, mixed tenant base, ~2y average lease.
- Zoned schools: Beasley El (math 42% / reading 27%, grade F, #1,995 of 4,322 statewide, top 50%, 366 students, 86% FRL); Lamar J H (math 30% / reading 34%, grade F, #971 of 1,662 statewide, top 60%, 1,246 students, 71% FRL); Lamar Cons H S (math 26% / reading 48%, grade F, #897 of 1,632 statewide, top 57%, 1,762 students, 62% FRL) — zoned schools average 73% FRL vs 43% district-wide (30 pts higher); higher-poverty schools than district average — tighter screening recommended.
- Zoned-school proficiency averages 34% at this address vs 52% district-wide (-17 pts) — the specific schools serving this property underperform the Lamar CISD average; the district grade overstates school quality for this exact location.
- Market conditions: 232 active listings in the ZIP; 1 comparable units currently listed for rent nearby; 12,093 units permitted in Fort Bend County in 2024 (815 in 5+ unit buildings).
- Fort Bend County population projected at +75% by 2050 — long-run rental-demand tailwind backs the buy-and-hold thesis.
- 3 sale attempts with the ask held roughly flat each time — persistent listings suggest the price (not the market) is what's stuck; bring a comps-based counter.
- At projected returns (4.2% appreciation + 3.0% rent growth), your $80k cash investment doubles in ~5 years — after that, you're playing with house money.
- By year 3, paydown + projected appreciation supports a ~$34k cash-out refi (75% LTV) — recoverable capital for the next deal without selling this one.
- Cap rate 6.2% vs local median 3.4% in Rosenberg — top-decile yield for the area; either an underpriced asset or a hidden risk that comps aren't pricing in. Stress-test before assuming the spread holds.
Questions for listing agent
- What do current leases actually rent for vs. the listed asking? Can we see a recent rent roll and the last 12 months of T-12 income?
- What does the HOA fee cover, when was the last increase, and are there any pending special assessments or reserve-fund shortfalls?
- Is there a deadline driving the sale (1031 exchange, divorce, estate, relocation)? That informs how much negotiation room exists.
- Schools are D-rated, which usually means shorter tenancies and higher turnover. Who's the typical renter profile here, and what's been the actual vacancy rate?
- The area grade is low — what's the realistic commute time and amenity access for the typical tenant pool here? Any planned neighborhood developments (good or bad) we should know about?
- What's the average days-on-market for RENTAL listings here right now (not sales)? A rising rental-DOM trend means longer vacancies and softer asking-rent achievability than the comps imply.
- What's the recent tenant-quality profile in this submarket — average credit score on applications, eviction rate, late-payment / NSF rate, and stable-employment percentage? A property-management company in the area should have these aggregated.
- How much new for-sale + rental construction is in the pipeline within 1–3 miles? Heavy new supply typically softens prices + rents 12–24 months out; constrained supply supports both.
CashFlowRE · CFR-K90HXM0TMY6AHY
· Data 1 day ago
cashflowre.app · 2026-05-29