 🏗️ New Construction
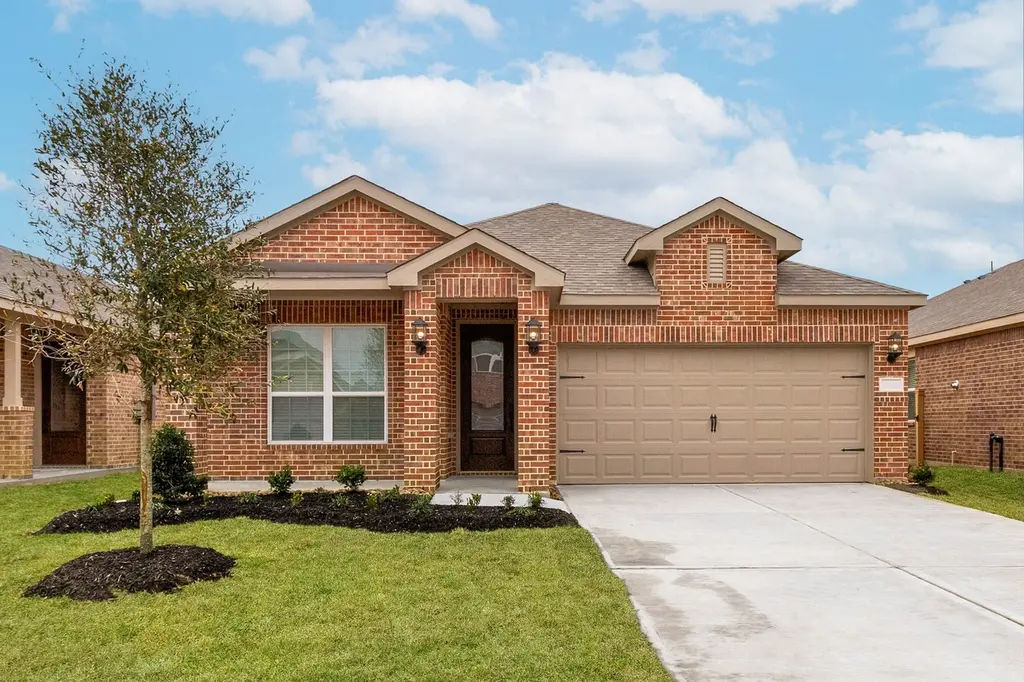
1111 Campside Dr · Rosenberg, TX
Flood risk No data
- FEMA flood zone
- —
- Chance of flooding over 30 yrs
- —
- Est. flood insurance / yr
- —
Fire risk No data
- Est. fire insurance / yr
- —
Heat risk No data
- Hot days now (above threshold)
- —
- Hot days in 30 yrs
- —
Wind risk No data
- Chance of severe wind over 30 yrs
- —
Air-quality risk No data
- Unhealthy air days now
- —
- Unhealthy air days in 30 yrs
- —
Risk factors via First Street. Map © Google.
Why this score? — see what drove the D+ grade
The composite is a weighted blend of 9 inputs, each scored 0–100. Each bar is that input's sub-score; the figure is the points it added to the 100-point composite (weight × sub-score).
- Cash flow +12.9/30.0
- ARV discount +7.5/15.0
- Appreciation +7.1/10.0
- Schools +4.6/10.0
- DSCR +3.9/10.0
- 1% rule +3.3/10.0
- Livability +3.1/5.0
- Rent growth +2.5/5.0
- Condition / age +2.5/5.0
$312,900
🖨 Deal sheet (PDF) 📄 Offer letter ✓ Due diligence
Listing remarks
The gorgeous Pintail features three bedrooms, two bathrooms, a laundry room and abundant curb appeal. Hosting friends and family is a breeze in the open-concept Pintail. The chef-ready kitchen features a full suite of Whirlpool appliances, a walk-in pantry, granite countertops, high-grade wood cabinets and recessed LED lighting. An island with a breakfast bar overlooks the sprawling family room, which features plank flooring, a ceiling fan and access to the back yard. To extend the entertainment space, an extended back patio can be used for so much fun! The master suite showcases a spacious attached bathroom with a soaker tub, glass-enclosed shower, sprawling vanity, plus a walk-in closet!
Key facts
- Open-concept
- Chef-ready kitchen
- Granite countertops
Tags
Property features AI
Finance
- Financial info: Lease considered
- HOA & community: Emberly Homeowners Association; Annual association fee
Exterior
- Parking: Attached 2-car garage
- Security: Smoke detector(s)
- Utilities: Public water; Public sewer
- Home design: Residential property; Under construction (new construction); Single-story (entry level: First floor)
- Construction: Built in 2026; Brick construction; Composition roof; Slab foundation
- Exterior features: Back yard fencing; Fence; Sprinkler/irrigation; Paved driveway
Interior
- Kitchen: Dishwasher; Gas cooktop; Gas oven; Microwave; Disposal; Refrigerator
- Bedrooms: Primary bedroom (First floor) — 13 x 15; Bedroom (First floor) — 10 x 10; Bedroom (First floor) — 10 x 11
- Flooring: Plank flooring; Vinyl flooring
- Bathrooms: 2 full bathrooms; Primary bathroom (First floor) — 9 x 12; Bathroom (First floor) — 7 x 8
- Heating & cooling: Heat pump heating; Central air conditioning (electric)
- Interior features: Entrance foyer; Granite counters; High ceilings; Kitchen island; Pantry; Soaking tub; Separate shower; Tub/shower; Vanity; Window treatments; Ceiling fans; Kitchen/dining combo; Living/dining room; Programmable thermostat; Low emissivity windows; Window coverings; ENERGY STAR qualified appliances; Instant hot water; Tankless water heater
- Laundry & utility: Washer hookup; Electric dryer hookup; Utility room (First floor) — 6 x 6
Neighborhood map
What this means for you Summary
Snapshot
- This is a 3-bed/2.0-bath land listed at $313k.
Deal economics
- At list price, monthly cash flow is $-19 ($-230/yr) — negative.
- To cash-flow at today's rent, offer at most $284k (9.3% below list).
- To meet the 1% rule (rent ≥ 1% of price), the offer needs to be $238k (24.1% below list).
- Recommended offer: $238k (24.1% below list) — sets the bar for 1% rule.
- Cap rate 6.2% vs local median 3.4% in Rosenberg — top-decile yield for the area; either an underpriced asset or a hidden risk that comps aren't pricing in. Stress-test before assuming the spread holds.
Location & tenants
- Location reads 62/100 on livability (#922 in TX) — a middle-class / working-renter tenant base. Strengths: cost of living A+, housing A+, crime B; Watch: amenities F, commute F, health & safety F.
- Lamar CISD (suburban): math 50% / reading 53% proficiency, ranked #116 of 826 in TX (top 14%) — acceptable for families but not a draw, mixed tenant base, ~2y average lease.
- Zoned schools: Beasley El (math 42% / reading 27%, grade F, #1,995 of 4,322 statewide, top 50%, 366 students, 86% FRL); Lamar J H (math 30% / reading 34%, grade F, #971 of 1,662 statewide, top 60%, 1,246 students, 71% FRL); Lamar Cons H S (math 26% / reading 48%, grade F, #897 of 1,632 statewide, top 57%, 1,762 students, 62% FRL) — zoned schools average 73% FRL vs 43% district-wide (30 pts higher); higher-poverty schools than district average — tighter screening recommended.
- Zoned-school proficiency averages 34% at this address vs 52% district-wide (-17 pts) — the specific schools serving this property underperform the Lamar CISD average; the district grade overstates school quality for this exact location.
- Market conditions: 232 active listings in the ZIP; 1 comparable units currently listed for rent nearby; 12,093 units permitted in Fort Bend County in 2024 (815 in 5+ unit buildings).
Forward outlook
- In year one you build about $14k of equity ($2k loan paydown + $12k appreciation (4.2% local appreciation)).
- Fort Bend County population projected at +75% by 2050 — long-run rental-demand tailwind backs the buy-and-hold thesis.
- At projected returns (4.2% appreciation + 3.0% rent growth), your $80k cash investment doubles in ~5 years — after that, you're playing with house money.
- By year 3, paydown + projected appreciation supports a ~$34k cash-out refi (75% LTV) — recoverable capital for the next deal without selling this one.
Negotiation context
- Only 11 days on market — expect competitive offers; lowballing is unlikely to land.
- 3 sale attempts with the ask held roughly flat each time — persistent listings suggest the price (not the market) is what's stuck; bring a comps-based counter.
Questions for the listing agent
- What do current leases actually rent for vs. the listed asking? Can we see a recent rent roll and the last 12 months of T-12 income?
- What does the HOA fee cover, when was the last increase, and are there any pending special assessments or reserve-fund shortfalls?
- Is there a deadline driving the sale (1031 exchange, divorce, estate, relocation)? That informs how much negotiation room exists.
- Schools are D-rated, which usually means shorter tenancies and higher turnover. Who's the typical renter profile here, and what's been the actual vacancy rate?
- The area grade is low — what's the realistic commute time and amenity access for the typical tenant pool here? Any planned neighborhood developments (good or bad) we should know about?
- What's the average days-on-market for RENTAL listings here right now (not sales)? A rising rental-DOM trend means longer vacancies and softer asking-rent achievability than the comps imply.
- What's the recent tenant-quality profile in this submarket — average credit score on applications, eviction rate, late-payment / NSF rate, and stable-employment percentage? A property-management company in the area should have these aggregated.
- How much new for-sale + rental construction is in the pipeline within 1–3 miles? Heavy new supply typically softens prices + rents 12–24 months out; constrained supply supports both.
Investment metrics
- 1% rule
- 0.83% ✗
- Cap rate
- 6.21%
- Cash-on-cash
- -0.29%
- DSCR
- 0.99
- GRM
- 10.1
CMA / ARV
- ARV (median comp)
- $287,143
- List price
- $312,900
- Delta
- 10.71%
- Verdict
- OVERPRICED
- Comps
- 20 within 1.0 mi
Projected returns pro-forma
4.15% appreciation · 3.0% rent growth · sell at horizon
- IRR
- 10.4%
- Equity multiple
- 1.64×
- Total profit
- $51,264
- Equity at exit
- $148,165
- IRR
- 12.1%
- Equity multiple
- 3.03×
- Total profit
- $163,175
- Equity at exit
- $244,417
Cash invested: $80,400 (down + closing). Projections, not guarantees.
Landlord ↔ Tenant lean methodology
- Overall (STATE)
- 87 Strongly Landlord-Friendly
- State Texas
- 87 Strongly Landlord-Friendly · R+5
- County
- — inherits STATE
- City
- — inherits STATE
ZIP-level market 77417
- Home prices YoY
- 1.2%
- Active inventory
- 232
- Price-to-rent
- 11.0×
Monthly cashflow live
- Estimated rent
- $2,375 medium interval (Pro) →
- Mortgage (P&I)
- −$1,506
- Tax from tax record
- −$130 /mo · $1,559/yr
- Insurance
- −$120
- HOA
- −$140
- Vacancy / Maint / Mgmt
- −$499
- Net cashflow
- $-19
Break-even live
Sensitivity live
| Price | -10% $143 | -5% $62 | +0% $-19 | +5% $-100 | +10% $-182 |
|---|---|---|---|---|---|
| Rent | -10% $-207 | -5% $-113 | +0% $-19 | +5% $75 | +10% $168 |
| Rate | -1.0pp $125 | -0.5pp $54 | base $-19 | +0.5pp $-94 | +1.0pp $-169 |
UW: 25.0% down · 7.5% · 30yr · 1.5% tax · 5.0% vac · 8.0% maint · 8.0% mgmt
Financing live
Cash to close
- Down payment
- $71,786
- Closing costs
- $8,614
- Reserves months
- —
- Total cash needed
- —
Loan-product check · same deal, 3 products live
Conventional
25% down · 7.5% · 30yr
- Down + closing
- —
- Monthly P&I
- —
- Monthly cashflow
- —
- DSCR
- —
- Eligible?
- —
Personal DTI + credit; lowest rate.
DSCR
20% down · 8.5% · 30yr
- Down + closing
- —
- Monthly P&I
- —
- Monthly cashflow
- —
- DSCR
- —
- Eligible?
- —
No personal income docs; deal must DSCR.
Hard money
10% down · 12.0% · 12mo
- Down + closing
- —
- Monthly P&I
- —
- Monthly cashflow
- —
- DSCR
- —
- Eligible?
- —
Short-term bridge; refi at stabilization.
Rent comps 1 comps
| Address | Beds | Baths | Sqft | Rent | $/sqft | DOM | Units | Dist |
|---|---|---|---|---|---|---|---|---|
| 10730 Sky Creek Ln Beasley, TX | 3.0–4.0 | 2.0–2.5 | 1869 | $2,375 | $1.27 | 0d | 1 | 0.65mi |
HOA detail
- Monthly dues
- $140 · $1,680/yr
- Likely covers
- pool
Listing history 14 events
-
2026-06-21days on market $312,900 Active 11 DOM
-
2026-06-18days on market $312,900 Active 8 DOM
-
2026-06-17days on market $312,900 Active 7 DOM
-
2026-06-16days on market $312,900 Active 6 DOM
-
2026-06-15days on market $312,900 Active 5 DOM
-
2026-06-13days on market $312,900 Active 3 DOM
-
2026-06-08days on market $312,900 Active 47 DOM
-
2026-06-07days on market $312,900 Active 46 DOM
-
2026-06-04pricedays on market $312,900 Active 43 DOM
-
2026-06-03days on market $317,900 Active 42 DOM
-
2026-06-02days on market $317,900 Active 41 DOM
-
2026-06-01days on market $317,900 Active 40 DOM
-
2026-05-31days on market $317,900 Active 39 DOM
-
2026-04-22$317,900 Active 698-char remark
ⓘ Source: listings_history table (triggers on properties + properties_extension) + one-shot
backfill from property_details.listing_events for pre-trigger history.
Tax reassessment forecast TX · Resets to sale price
- Current annual tax
- $1,559 · $130/mo
- Projected year-2 tax
- $5,726 · $477/mo
- Expected delta
- +$4,167/yr (+$347/mo · 267.3%)
ⓘ Screening estimate from a state-policy table — verify with the county assessor before closing.
Nearby sold comps map
Loading sold comps map…
Walkable amenities ~0.75 mi
Loading nearby amenities…
Taxation est. · year 1
- Rental income
- $28,500
- − Mortgage interest
- −$16,084
- − Property taxes
- −$1,559
- − Insurance
- −$1,436
- − Repairs & maintenance
- −$2,280
- − Management
- −$2,280
- − HOA
- −$1,680
- − Depreciation
- −$8,353
- Taxable loss
- −$5,173
- Est. tax savings @ 24.0%
- +$1,241
- After-tax cash flow
- $1,012/yr
For passive investors: Depreciation is non-cash, so a rental often shows a tax loss while cash-flowing — sheltering income. Rental losses are passive: they offset passive income freely, and up to $25,000/yr can offset ordinary (W-2) income if you actively participate and your MAGI is under $100k (phasing out to $0 by $150k); unused losses carry forward. On sale, claimed depreciation is recaptured at up to 25%, and gains may owe capital-gains tax (a 1031 exchange can defer both). Figures are a year-1 estimate at your 24.0% rate — not tax advice; consult a CPA.
Schools (NCES district)
- District
- Lamar CISD
- NCES district ID
- 4826580
- Math proficiency
- 50% ▼ -12.00%
- Reading proficiency
- 53% ▼ -4.00%
- Median HH income
- $75,213
- Composite
- 46.43/100
- National rank
- #2452
- State rank
- #116 of 826 in TX
Livability — Rosenberg
- Score
- 62/100
- State rank
- #922
- US rank
- #16414
Category grades
Schools grade is shown separately in the Schools card above.
Census & demographics
- City population
- 115,151
- Population (ZIP)
- 3,232
Population outlook (Fort Bend County) Hauer SSP2
- Today (2025)
- 1,004,526 people
- By 2030
- 1,153,104 · +14.8%
- By 2040
- 1,453,718 · +44.7%
- By 2050
- 1,753,781 · +74.6%
- By 2075
- 2,455,772 · +144.5%
- By 2100
- 2,930,528 · +191.7%
Race, ethnicity, and origin ACS 2023
- Neighborhood character
- Predominantly Hispanic (67%)
- Race & ethnicity
- Hispanic / Latino 67% Two or more races 49% White 22% Black 8%
- Hispanic origin (detail)
- Mexican 54%
- Common ancestry
- Italian 2% Romanian 1%
- Foreign-born
- 3% · Canada
- Languages at home
- 76% English-only · Spanish 24%
Political lean MEDSL · Fort Bend
- 2024 margin
- Toss-up / Even · D 49.5% · R 47.9% · Other 2.6%
- 2008→2024 swing
- +4.0pp toward D · 2008: -2.4pp · 2024: 1.6pp
- All cycles
- 2024: D+1.6 2020: D+10.6 2016: D+6.6 2012: R+6.8 2008: R+2.4
Not yet ingested
- Civics
- —
Market trends
- HPI YoY
- ▲ 4.15%
- Current HPI
- 337.8236
- Rent YoY
- —
- Metro
- —
- State GDP YoY
- ▲ 3.95%
- F500 in state
- 110
Industry mix (Fortune 500 HQ in TX)
| Industry | F500 HQs | Revenue |
|---|---|---|
| Energy | 16 | $1,198B |
|
||
| Technology | 5 | $198B |
|
||
| Engineering / Construction | 4 | $72B |
|
||
| Energy Services | 3 | $60B |
|
||
| Utilities | 3 | $41B |
|
||
| Healthcare | 2 | $330B |
|
||
Price history
-1.6% since first listed5 events — show timeline
- 2026-06-10 Listed $312,900 HARMLS
- 2026-06-08 Listing Removed — HARMLS
- 2026-06-05 Listed for Rent $2,595 HARMLS
- 2026-06-03 Price Changed $312,900 HARMLS
- 2026-04-22 Listed $317,900 HARMLS
Cash-flow waterfall
monthlySold comps — $/sqft
last 12 mo · ≤1 miLoading sold comps…