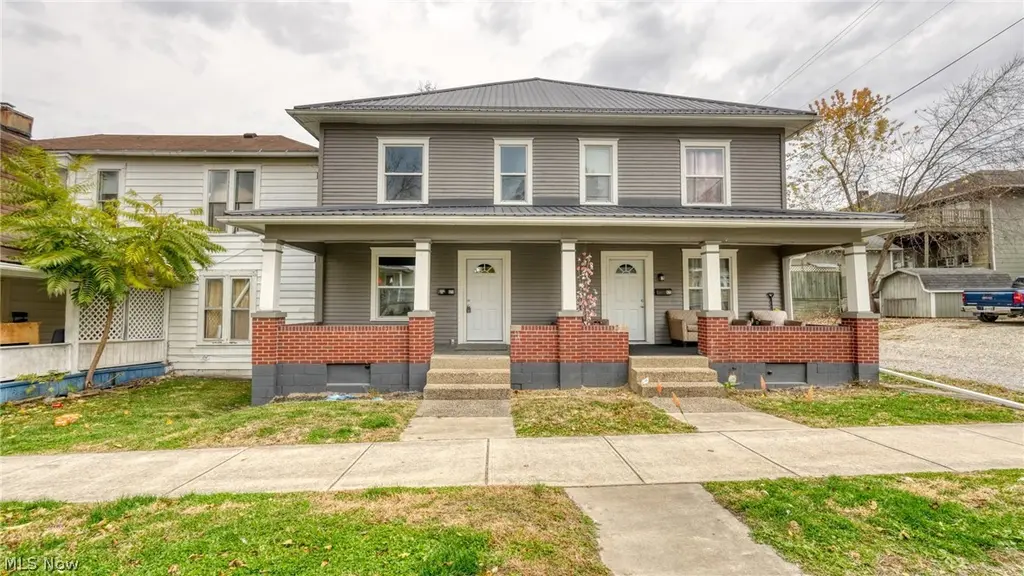
825 Beatty Ave
Cambridge, OH 43725
$259,000B-
8 bd · 1.0 ba ·
3,042 sqft ·
Built 1900
· MultiFamily
· Active
· 42 DOM
Cashflow @ list (25.0% down · 7.5%)
Estimated rent
$3,325/mo
Mortgage (P&I)
−$1,358
Tax + insurance
−$277
HOA
−$0
Vac / Maint / Mgmt
−$698
Net cashflow
$991/mo
Annual
$11,898/yr
Cap rate
11.14%
Cash-on-cash
17.33%
DSCR
1.77
1% rule
1.28%
Cash to close
$72,520
Investor read
- This is a 2 × 4-bed/1.0-bath units multifamily listed at $259k.
- At list price, monthly cash flow is $991 ($12k/yr) — positive. Per door: $496/mo.
- The deal already cash-flows at list — no discount required.
- Meets the 1% rule at list price ($3k rent vs $259k).
- It's been on market 42 days — a 3% lower offer ($251k) is reasonable based on typical stale-listing flexibility.
- Recommended offer: $251k (3.0% below list) — sets the bar for market timing.
- Local home prices are declining (-3.0%/yr); year-one equity from $2k of loan paydown is wiped out by about $8k of value loss. Plan a longer hold.
- Location reads 68/100 on livability (#579 in OH) — a middle-class / working-renter tenant base. Strengths: cost of living A+, housing A+, crime A-; Watch: amenities D-, commute F, employment D-.
- Cambridge City (town): math 28% / reading 42% proficiency, ranked #565 of 656 in OH (top 86%) — families likely to look elsewhere, expect single-tenant / working-renter base with shorter leases.
- Watch-outs: flood insurance adds $56/mo; built in 1900 — expect roof / HVAC / electrical / plumbing capex.
- Market conditions: 90 active listings in the ZIP; 37 units permitted in Guernsey County in 2024 (0 in 5+ unit buildings).
- Guernsey County population projected at -20% by 2050 — secular population decline; favor cash flow + early exit over multi-decade hold.
- 6 sale attempts since 4y ago with the ask held roughly flat each time — persistent listings suggest the price (not the market) is what's stuck; bring a comps-based counter.
- Current owner paid $66k; list at $259k implies a 292% gain — meaningful room to come down on a strong offer.
- At projected returns (-3.0% appreciation + 3.0% rent growth), your $73k cash investment doubles in ~8 years — after that, you're playing with house money.
- Climate carrying-cost: major flood risk — expect insurance premiums to compound above CPI over the hold.
- Cap rate 11.1% vs local median 5.7% in Cambridge — top-decile yield for the area; either an underpriced asset or a hidden risk that comps aren't pricing in. Stress-test before assuming the spread holds.
- At $3,325/mo this rent would consume 77% of the median local household income ($52k/yr) — very limited rent-growth headroom before tenants either downsize or default.
Questions for listing agent
- It's been on market 42 days. Have you received any prior offers? Is the seller open to a 3% concession, seller financing, or rate buy-down credit?
- Can we see the unit-by-unit rent roll, current vacancy, and any below-market leases? What's the average tenancy length?
- What capital expenditures (roof, boiler, parking lot, exteriors) have been made in the last 5 years, and what's planned in the next 2?
- Built in 1900 — when were the roof, HVAC, electrical panel, plumbing, and water heater last replaced?
- What's the actual annual flood-insurance premium (NFIP or private), and is the property in a SFHA with mandatory coverage?
- Is there a deadline driving the sale (1031 exchange, divorce, estate, relocation)? That informs how much negotiation room exists.
- What's the average days-on-market for RENTAL listings here right now (not sales)? A rising rental-DOM trend means longer vacancies and softer asking-rent achievability than the comps imply.
- What's the recent tenant-quality profile in this submarket — average credit score on applications, eviction rate, late-payment / NSF rate, and stable-employment percentage? A property-management company in the area should have these aggregated.
CashFlowRE · CFR-KA36NR24A627FS
· Data 2 days ago
cashflowre.app · 2026-05-29