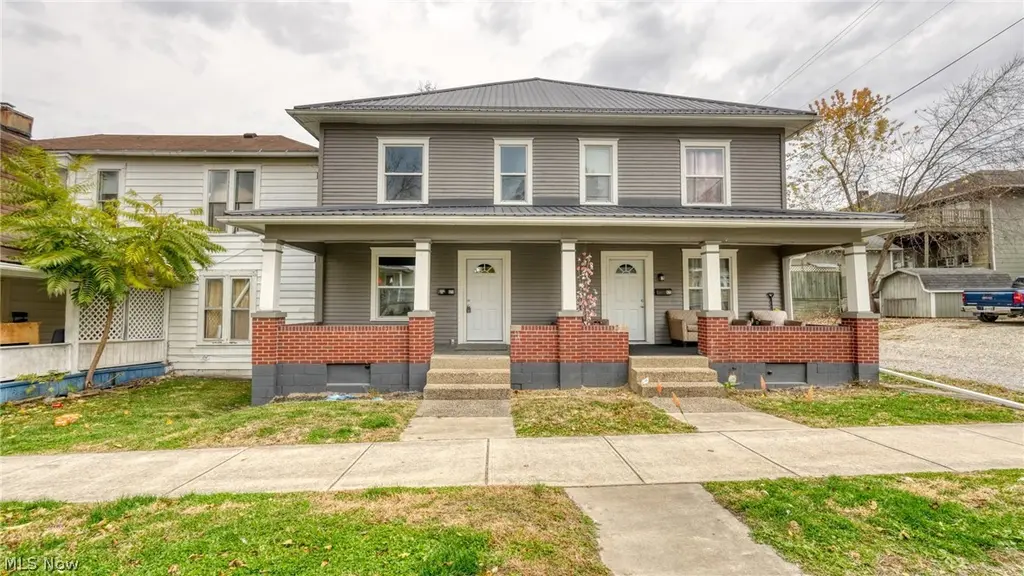
 Duplex
825 Beatty Ave · Cambridge, OH
Flood risk 7/10 · Major
- FEMA flood zone
- X (unshaded)
- Chance of flooding over 30 yrs
- 0.77%
- Est. flood insurance / yr
- $473 – $860
Fire risk 1/10 · Minimal
- Est. fire insurance / yr
- $713 – $1,323
Heat risk 4/10 · Minor
- Hot days now (above 99°F)
- 7 days/yr
- Hot days in 30 yrs
- 18 days/yr
Wind risk 1/10 · Minimal
- Chance of severe wind over 30 yrs
- 1.0%
Air-quality risk 2/10 · Minimal
- Unhealthy air days now
- 1 days/yr
- Unhealthy air days in 30 yrs
- 1 days/yr
Risk factors via First Street. Map © Google.
Why this score? — see what drove the B- grade
The composite is a weighted blend of 9 inputs, each scored 0–100. Each bar is that input's sub-score; the figure is the points it added to the 100-point composite (weight × sub-score).
- Cash flow +30.0/30.0
- DSCR +10.0/10.0
- 1% rule +7.8/10.0
- ARV discount +7.5/15.0
- Livability +3.4/5.0
- Schools +2.9/10.0
- Rent growth +2.5/5.0
- Condition / age +2.5/5.0
- Appreciation +0.0/10.0
$259,000
🖨 Deal sheet 📄 Offer letter ✓ Due diligence
Multi-family units
County records classify this as Multi-Family (2-4 Unit). Listing-text estimate: 2 units. confirmed
Listing remarks
Spacious and fully renovated in 2022, this duplex offers two large 4-bedroom units with strong existing cash flow. Both units are fully occupied and generate a combined $2,560 in monthly rents. Each unit is separately metered for added convenience and lower operating complexity. Situated in an unbeatable location—within walking distance to downtown, just minutes from the hospital, and only five minutes from major interstate access. Ideal for tenants seeking accessibility and comfort, this turnkey duplex is well-positioned for long-term performance. With its generous layouts, updated finishes, and prime location, this turnkey duplex is an excellent opportunity for both new and seasoned
Key facts
- 6,804 sq ft lot
- Built 1900
- Listed 42 days
Property features AI
Finance
- Financial info: Gross monthly income reported as $2,560; Unit rents reported as $1,250 and $1,310; Both units marked as leased; One lease expires March 1, 2027; Tenants pay all utilities; HUD voucher tenants
Exterior
- Parking: On-site parking; Street parking
- Utilities: Public water; Public sewer
- Home design: 2-story multi-family (apartments); Single building
- Construction: Wood siding; Metal roof; Block foundation; Built per public records
- Exterior features: On-site parking and street parking
Interior
- Kitchen: Range; Refrigerator
- Bedrooms: Two 4-bedroom apartment units
- Bathrooms: Two full bathrooms (one per unit)
- Heating & cooling: Gas forced air heating; Window air conditioning units
- Interior features: Full walk-out basement
- Laundry & utility: Laundry located in the basement
Neighborhood map
What this means for you Summary
Snapshot
- This is a 2 × 4-bed/1.0-bath units multifamily listed at $259k.
Deal economics
- At list price, monthly cash flow is $991 ($12k/yr) — positive. Per door: $496/mo.
- The deal already cash-flows at list — no discount required.
- Meets the 1% rule at list price ($3k rent vs $259k).
- Recommended offer: $251k (3.0% below list) — sets the bar for market timing.
- Cap rate 11.1% vs local median 5.7% in Cambridge — top-decile yield for the area; either an underpriced asset or a hidden risk that comps aren't pricing in. Stress-test before assuming the spread holds.
Location & tenants
- Location reads 68/100 on livability (#579 in OH) — a middle-class / working-renter tenant base. Strengths: cost of living A+, housing A+, crime A-; Watch: amenities D-, commute F, employment D-.
- Cambridge City (town): math 28% / reading 42% proficiency, ranked #565 of 656 in OH (top 86%) — families likely to look elsewhere, expect single-tenant / working-renter base with shorter leases.
- Market conditions: 90 active listings in the ZIP; 37 units permitted in Guernsey County in 2024 (0 in 5+ unit buildings).
- At $3,325/mo this rent would consume 77% of the median local household income ($52k/yr) — very limited rent-growth headroom before tenants either downsize or default.
Forward outlook
- Local home prices are declining (-3.0%/yr); year-one equity from $2k of loan paydown is wiped out by about $8k of value loss. Plan a longer hold.
- Guernsey County population projected at -20% by 2050 — secular population decline; favor cash flow + early exit over multi-decade hold.
- At projected returns (-3.0% appreciation + 3.0% rent growth), your $73k cash investment doubles in ~8 years — after that, you're playing with house money.
Negotiation context
- It's been on market 42 days — a 3% lower offer ($251k) is reasonable based on typical stale-listing flexibility.
- 6 sale attempts since 4y ago with the ask held roughly flat each time — persistent listings suggest the price (not the market) is what's stuck; bring a comps-based counter.
- Current owner paid $66k; list at $259k implies a 292% gain — meaningful room to come down on a strong offer.
Risks & watch-outs
- Watch-outs: flood insurance adds $56/mo; built in 1900 — expect roof / HVAC / electrical / plumbing capex.
- Climate carrying-cost: major flood risk — expect insurance premiums to compound above CPI over the hold.
Questions for the listing agent
- It's been on market 42 days. Have you received any prior offers? Is the seller open to a 3% concession, seller financing, or rate buy-down credit?
- Can we see the unit-by-unit rent roll, current vacancy, and any below-market leases? What's the average tenancy length?
- What capital expenditures (roof, boiler, parking lot, exteriors) have been made in the last 5 years, and what's planned in the next 2?
- Built in 1900 — when were the roof, HVAC, electrical panel, plumbing, and water heater last replaced?
- What's the actual annual flood-insurance premium (NFIP or private), and is the property in a SFHA with mandatory coverage?
- Is there a deadline driving the sale (1031 exchange, divorce, estate, relocation)? That informs how much negotiation room exists.
- What's the average days-on-market for RENTAL listings here right now (not sales)? A rising rental-DOM trend means longer vacancies and softer asking-rent achievability than the comps imply.
- What's the recent tenant-quality profile in this submarket — average credit score on applications, eviction rate, late-payment / NSF rate, and stable-employment percentage? A property-management company in the area should have these aggregated.
- How much new apartment / multifamily construction is in the pipeline within 1–3 miles? Heavy new supply (>2% of stock underway) typically softens rents 12–24 months out; light construction supports rent growth.
Investment metrics
- 1% rule
- 1.28% ✓
- Cap rate
- 11.14%
- Cash-on-cash
- 17.33%
- DSCR
- 1.77
- GRM
- 6.5
CMA / ARV
- ARV (median comp)
- $137,547
- List price
- $259,000
- Delta
- 88.30%
- Verdict
- OVERPRICED
- Comps
- 9 within 1.0 mi
Show comp detail 1 sale within ~0.75 mi
| Address | Dist | Beds/Ba | Sqft | Sold | Price | $/sf | Match |
|---|---|---|---|---|---|---|---|
| 132 N 9th St | 0.22mi | 8/4.0 | 3,312 (+9%) | 5mo | $255,550 | $77 | 59 |
Match score weights: distance 35% · size 25% · config 20% · recency 20%. Top-matched comps best support the ARV.
Projected returns pro-forma
-3.0% appreciation · 3.0% rent growth · sell at horizon
- IRR
- 7.5%
- Equity multiple
- 1.29×
- Total profit
- $21,135
- Equity at exit
- $38,618
- IRR
- 16.7%
- Equity multiple
- 2.37×
- Total profit
- $99,536
- Equity at exit
- $22,394
Cash invested: $72,520 (down + closing). Projections, not guarantees.
Landlord ↔ Tenant lean methodology
- Overall (STATE)
- 73 Landlord-Friendly
- State Ohio
- 73 Landlord-Friendly · R+6
- County
- — inherits STATE
- City
- — inherits STATE
ZIP-level market 43725
- Active inventory
- 90
- Price-to-rent
- 13.0×
Monthly cashflow live
- Estimated rent
- $3,325 medium interval (Pro) →
- Mortgage (P&I)
- −$1,358
- Tax from tax record
- −$114 /mo · $1,363/yr
- Insurance
- −$108
- Flood insurance flood zone
- −$56 /mo · $666/yr
- HOA
- −$0
- Vacancy / Maint / Mgmt
- −$698
- Net cashflow
- $991
Break-even live
2-unit breakdown (identical units grouped — click to expand)
| Units | Beds | Baths | Est. rent |
|---|---|---|---|
| 2× units | 4 | 1 | $3,326 |
| #1 | 4 | 1 | $1,663 |
| #2 | 4 | 1 | $1,663 |
| Total (2 units) | $3,325 | ||
UW: 25.0% down · 7.5% · 30yr · 1.5% tax · 5.0% vac · 8.0% maint · 8.0% mgmt
Financing live
Cash to close
- Down payment
- $64,750
- Closing costs
- $7,770
- Reserves months
- —
- Total cash needed
- —
Loan-product check · same deal, 3 products live
Conventional
25% down · 7.5% · 30yr
- Down + closing
- —
- Monthly P&I
- —
- Monthly cashflow
- —
- DSCR
- —
- Eligible?
- —
Personal DTI + credit; lowest rate.
DSCR
20% down · 8.5% · 30yr
- Down + closing
- —
- Monthly P&I
- —
- Monthly cashflow
- —
- DSCR
- —
- Eligible?
- —
No personal income docs; deal must DSCR.
Hard money
10% down · 12.0% · 12mo
- Down + closing
- —
- Monthly P&I
- —
- Monthly cashflow
- —
- DSCR
- —
- Eligible?
- —
Short-term bridge; refi at stabilization.
Listing history 28 events
-
2026-06-18days on market $259,000 Active 42 DOM
-
2026-06-17days on market $259,000 Active 41 DOM
-
2026-06-16days on market $259,000 Active 40 DOM
-
2026-06-15days on market $259,000 Active 39 DOM
-
2026-06-13days on market $259,000 Active 37 DOM
-
2026-06-12days on market $259,000 Active 36 DOM
-
2026-06-09days on market $259,000 Active 33 DOM
-
2026-06-08days on market $259,000 Active 32 DOM
-
2026-06-07days on market $259,000 Active 31 DOM
-
2026-06-07days on market $259,000 Active 30 DOM
-
2026-06-04days on market $259,000 Active 27 DOM
-
2026-06-02days on market $259,000 Active 26 DOM
-
2026-06-01days on market $259,000 Active 25 DOM
-
2026-05-31days on market $259,000 Active 24 DOM
-
2026-05-13historical Contingent 710-char remark
-
2026-05-06$259,000 Active 710-char remark
-
2025-04-24historical
-
2025-04-23historical
-
2024-10-25$299,000 Active
-
2024-10-25$299,000 Active
-
2022-11-03soldstatus $66,000
-
2022-11-02soldstatus $66,000 Closed
-
2022-10-07historical Contingent
-
2022-10-03$59,900 Active
-
2022-04-27soldstatus $51,700
-
2022-04-18soldstatus $51,700 Closed
-
2022-03-25status Pending
-
2022-03-22$39,900 Active
ⓘ Source: listings_history table (triggers on properties + properties_extension) + one-shot
backfill from property_details.listing_events for pre-trigger history.
Tax reassessment forecast OH · Partial reset (capped growth)
- Current annual tax
- $1,363 · $114/mo
- Projected year-2 tax
- $2,702 · $225/mo
- Expected delta
- +$1,339/yr (+$112/mo · 98.2%)
ⓘ Screening estimate from a state-policy table — verify with the county assessor before closing.
Climate risk First Street
- Flood 7/10 Severe FEMA zone X (unshaded) · 77% chance over 30 yrs
- Wildfire 1/10 Low
- Heat 4/10 Moderate 7 d/yr ≥99°F today · 18 d/yr by 30 yrs out
- Wind 1/10 Low 100% chance of damaging wind over 30 yrs
- Air quality 2/10 Low 1 unhealthy d/yr today · 1 by 30 yrs out
Nearby sold comps map
Loading sold comps map…
Walkable amenities ~0.75 mi
Loading nearby amenities…
Taxation est. · year 1
- Rental income
- $39,900
- − Mortgage interest
- −$14,508
- − Property taxes
- −$1,363
- − Insurance
- −$1,962
- − Repairs & maintenance
- −$3,192
- − Management
- −$3,192
- − Depreciation
- −$7,535
- Taxable income
- $8,149
- Est. tax owed @ 24.0%
- −$1,956
- After-tax cash flow
- $9,942/yr
For passive investors: Depreciation is non-cash, so a rental often shows a tax loss while cash-flowing — sheltering income. Rental losses are passive: they offset passive income freely, and up to $25,000/yr can offset ordinary (W-2) income if you actively participate and your MAGI is under $100k (phasing out to $0 by $150k); unused losses carry forward. On sale, claimed depreciation is recaptured at up to 25%, and gains may owe capital-gains tax (a 1031 exchange can defer both). Figures are a year-1 estimate at your 24.0% rate — not tax advice; consult a CPA.
Schools (NCES district)
- District
- Cambridge City
- NCES district ID
- 3904369
- Math proficiency
- 28% ▼ -28.00%
- Reading proficiency
- 42% ▼ -17.00%
- Median HH income
- $33,874
- Composite
- 28.76/100
- National rank
- #6673
- State rank
- #565 of 656 in OH
Livability — Cambridge
- Score
- 68/100
- State rank
- #579
- US rank
- #9829
Category grades
Schools grade is shown separately in the Schools card above.
Census & demographics
- Census place
- Cambridge, OH
- County
- Guernsey · 34,843 people
- Population (ZIP)
- 19,728
- Household income
- $51,612
- Rent vs Own
- Severe rent burden
- 12.5
Population outlook (Guernsey County) Hauer SSP2
- Today (2025)
- 37,281 people
- By 2030
- 35,900 · -3.7%
- By 2040
- 32,861 · -11.9%
- By 2050
- 29,700 · -20.3%
- By 2075
- 22,199 · -40.5%
- By 2100
- 15,192 · -59.3%
Race, ethnicity, and origin ACS 2023
- Neighborhood character
- Predominantly White (91%)
- Race & ethnicity
- White 91% Two or more races 4% Black 3% Hispanic / Latino 2%
- Common ancestry
- Lithuanian 3% Slovak 2% Serbian 2%
- Foreign-born
- 1% · Canada
- Languages at home
- 98% English-only · Spanish 1% German/W. Germanic 1%
Political lean MEDSL · Guernsey
- 2024 margin
- Solid R (+52.1) · D 23.6% · R 75.7%
- 2008→2024 swing
- -43.0pp toward R · 2008: -9.1pp · 2024: -52.1pp
- All cycles
- 2024: R+52.1 2020: R+48.4 2016: R+42.6 2012: R+9.7 2008: R+9.1
Not yet ingested
- Civics
- —
Market trends
- HPI YoY
- ▼ -167.03%
- Current HPI
- 197.722
- Rent YoY
- —
- Metro
- —
- State GDP YoY
- ▲ 1.98%
- F500 in state
- 48
Industry mix (Fortune 500 HQ in OH)
| Industry | F500 HQs | Revenue |
|---|---|---|
| Insurance | 3 | $145B |
|
||
| Industrial Machinery | 3 | $49B |
|
||
| Financial Services | 3 | $24B |
|
||
| Consumer Goods | 2 | $93B |
|
||
| Aerospace / Defense | 2 | $47B |
|
||
| Utilities | 2 | $33B |
|
||
Price history
+549.1% since first listed15 events — show timeline
- 2026-05-25 Relisted — MLSNOW
- 2026-05-13 Contingent — MLSNOW
- 2026-05-06 Listed $259,000 MLSNOW
- 2025-04-24 Listing Removed — CBRMLS
- 2025-04-23 Listing Removed — MLSNOW
- 2024-10-25 Listed $299,000 MLSNOW
- 2024-10-25 Listed $299,000 CBRMLS
- 2022-11-03 Sold (Public Records) $66,000 Public Records
- 2022-11-02 Sold (MLS) $66,000 MLSNOW
- 2022-10-07 Contingent — MLSNOW
- 2022-10-03 Listed $59,900 MLSNOW
- 2022-04-27 Sold (Public Records) $51,700 Public Records
- 2022-04-18 Sold (MLS) $51,700 MLSNOW
- 2022-03-25 Pending — MLSNOW
- 2022-03-22 Listed $39,900 MLSNOW
Property tax history
+4.3%/yrLatest (2025): $1,363 · +2.6% YoY. Source: county tax records.
Cash-flow waterfall
monthlySold comps — $/sqft
last 12 mo · ≤1 miLoading sold comps…