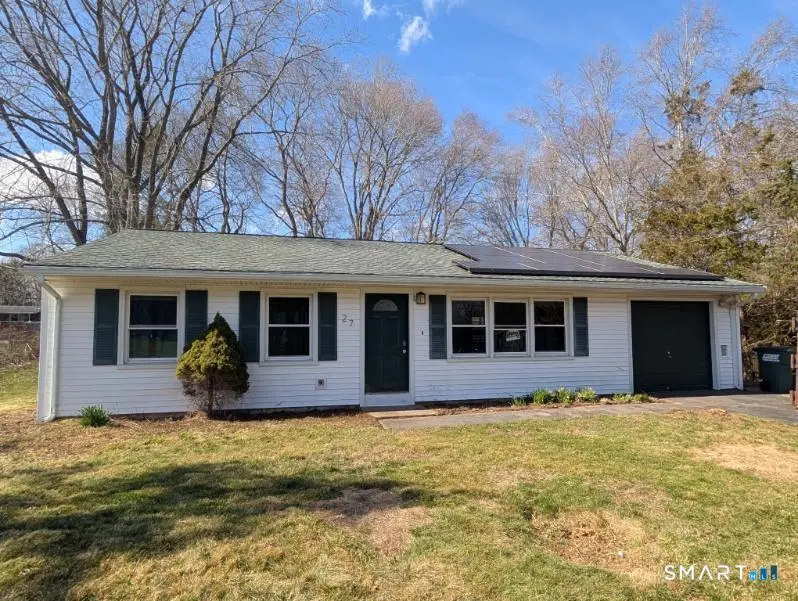
27 Highland Dr
Mashantucket, CT 06339
$238,900D+
3 bd · 1.0 ba ·
1,200 sqft ·
Built 1964
· SingleFamily
· Under Contract
· 7 DOM
Cashflow @ list (25.0% down · 7.5%)
Estimated rent
$2,150/mo
Mortgage (P&I)
−$1,253
Tax + insurance
−$467
HOA
−$0
Vac / Maint / Mgmt
−$452
Net cashflow
$-22/mo
Annual
$-259/yr
Cap rate
6.18%
Cash-on-cash
-0.39%
DSCR
0.98
1% rule
0.90%
Cash to close
$66,892
Investor read
- This is a 3-bed/1.0-bath single-family listed at $239k.
- At list price, monthly cash flow is $-22 ($-259/yr) — negative.
- To cash-flow at today's rent, offer at most $235k (1.6% below list).
- To meet the 1% rule (rent ≥ 1% of price), the offer needs to be $215k (10.0% below list).
- Only 7 days on market — expect competitive offers; lowballing is unlikely to land.
- Recommended offer: $215k (10.0% below list) — sets the bar for 1% rule.
- Local home prices are declining (-3.0%/yr); year-one equity from $2k of loan paydown is wiped out by about $7k of value loss. Plan a longer hold.
- Location reads 71/100 on livability (#89 in CT) — a middle-class / working-renter tenant base. Strengths: employment A+, housing A+, health & safety A+; Watch: schools D, amenities F, commute F.
- Ledyard School District (rural): math 34% / reading 49% proficiency, ranked #92 of 153 in CT (top 60%) — families likely to look elsewhere, expect single-tenant / working-renter base with shorter leases; only 15% free/reduced lunch — higher-income household profile.
- Market conditions: 36 active listings in the ZIP; 1 comparable units currently listed for rent nearby; 487 units permitted in Southeastern Connecticut Planning Region in 2024 (244 in 5+ unit buildings).
- 3 sale attempts since 27y ago with the ask held roughly flat each time — persistent listings suggest the price (not the market) is what's stuck; bring a comps-based counter.
- Current owner paid $102k; list at $239k implies a 133% gain — meaningful room to come down on a strong offer.
- Climate carrying-cost: major wind risk, 78% chance of damaging wind over 30y; extreme-heat days projected 7→16/yr by 2055 (HVAC capex compounding) — expect insurance premiums to compound above CPI over the hold.
- Cap rate 6.2% vs local median 3.6% in Mashantucket — top-decile yield for the area; either an underpriced asset or a hidden risk that comps aren't pricing in. Stress-test before assuming the spread holds.
Questions for listing agent
- What do current leases actually rent for vs. the listed asking? Can we see a recent rent roll and the last 12 months of T-12 income?
- Built in 1964 — when were the roof, HVAC, electrical panel, plumbing, and water heater last replaced?
- Is there a deadline driving the sale (1031 exchange, divorce, estate, relocation)? That informs how much negotiation room exists.
- Schools are D-rated, which usually means shorter tenancies and higher turnover. Who's the typical renter profile here, and what's been the actual vacancy rate?
- The area grade is low — what's the realistic commute time and amenity access for the typical tenant pool here? Any planned neighborhood developments (good or bad) we should know about?
- What's the average days-on-market for RENTAL listings here right now (not sales)? A rising rental-DOM trend means longer vacancies and softer asking-rent achievability than the comps imply.
- What's the recent tenant-quality profile in this submarket — average credit score on applications, eviction rate, late-payment / NSF rate, and stable-employment percentage? A property-management company in the area should have these aggregated.
- How much new for-sale + rental construction is in the pipeline within 1–3 miles? Heavy new supply typically softens prices + rents 12–24 months out; constrained supply supports both.
CashFlowRE · CFR-KASGA35TY3CWJ4
· Data 3 weeks ago
cashflowre.app · 2026-05-29