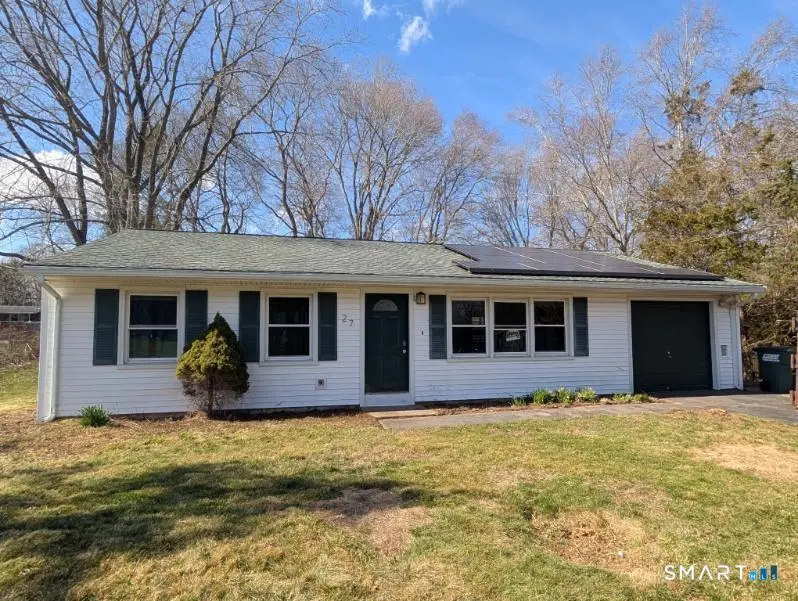
27 Highland Dr · Mashantucket, CT
Flood risk 1/10 · Minimal
- FEMA flood zone
- X (unshaded)
- Chance of flooding over 30 yrs
- 0.0%
- Est. flood insurance / yr
- $507 – $1,088
Fire risk 3/10 · Minor
- Est. fire insurance / yr
- $829 – $1,539
Heat risk 5/10 · Moderate
- Hot days now (above 94°F)
- 7 days/yr
- Hot days in 30 yrs
- 16 days/yr
Wind risk 7/10 · Major
- Chance of severe wind over 30 yrs
- 78.0%
Air-quality risk 3/10 · Minor
- Unhealthy air days now
- 2 days/yr
- Unhealthy air days in 30 yrs
- 3 days/yr
Risk factors via First Street. Map © Google.
Why this score? — see what drove the D+ grade
The composite is a weighted blend of 9 inputs, each scored 0–100. Each bar is that input's sub-score; the figure is the points it added to the 100-point composite (weight × sub-score).
- ARV discount +15.0/15.0
- Cash flow +12.8/30.0
- 1% rule +4.0/10.0
- Schools +3.9/10.0
- DSCR +3.8/10.0
- Livability +3.6/5.0
- Rent growth +2.5/5.0
- Condition / age +2.5/5.0
- Appreciation +0.0/10.0
$238,900
🖨 Deal sheet 📄 Offer letter ✓ Due diligence
Listing remarks MLS
Great value in this efficient ranch home - fully applianced kitchen - large level yard - new shed - neat and clean! A pleasure to show - room off kitchen suitable for dining room or family room.
Key facts
- City water
- New oil tank
- One floor living
Tags
Property features AI
Exterior
- Utilities: Public water connected; Public sewer connected; Active solar
- Home design: Single-family home
- Construction: Built with frame construction; Vinyl siding; Asphalt shingle roof; Slab foundation
- Exterior features: Shed; Lightly wooded, level lot
Interior
- Kitchen: Oven/Range; Refrigerator
- Bedrooms: 3 bedrooms
- Bathrooms: 1 full bathroom
- Heating & cooling: Hot water heating (oil-fired) with above-ground fuel tank
- Interior features: Ceiling fans; Attic with pull-down stairs; No basement
- Laundry & utility: Laundry on main level; Washer; Dryer; Tankless hot water
Neighborhood map
What this means for you Summary
Snapshot
- This is a 3-bed/1.0-bath single-family listed at $239k.
Deal economics
- At list price, monthly cash flow is $-22 ($-259/yr) — negative.
- To cash-flow at today's rent, offer at most $235k (1.6% below list).
- To meet the 1% rule (rent ≥ 1% of price), the offer needs to be $215k (10.0% below list).
- Recommended offer: $215k (10.0% below list) — sets the bar for 1% rule.
- Cap rate 6.2% vs local median 3.6% in Mashantucket — top-decile yield for the area; either an underpriced asset or a hidden risk that comps aren't pricing in. Stress-test before assuming the spread holds.
Location & tenants
- Location reads 71/100 on livability (#89 in CT) — a middle-class / working-renter tenant base. Strengths: employment A+, housing A+, health & safety A+; Watch: schools D, amenities F, commute F.
- Ledyard School District (rural): math 34% / reading 49% proficiency, ranked #92 of 153 in CT (top 60%) — families likely to look elsewhere, expect single-tenant / working-renter base with shorter leases; only 15% free/reduced lunch — higher-income household profile.
- Market conditions: 36 active listings in the ZIP; 1 comparable units currently listed for rent nearby; 487 units permitted in Southeastern Connecticut Planning Region in 2024 (244 in 5+ unit buildings).
Forward outlook
- Local home prices are declining (-3.0%/yr); year-one equity from $2k of loan paydown is wiped out by about $7k of value loss. Plan a longer hold.
Negotiation context
- Only 7 days on market — expect competitive offers; lowballing is unlikely to land.
- 3 sale attempts since 27y ago with the ask held roughly flat each time — persistent listings suggest the price (not the market) is what's stuck; bring a comps-based counter.
- Current owner paid $102k; list at $239k implies a 133% gain — meaningful room to come down on a strong offer.
Risks & watch-outs
- Climate carrying-cost: major wind risk, 78% chance of damaging wind over 30y; extreme-heat days projected 7→16/yr by 2055 (HVAC capex compounding) — expect insurance premiums to compound above CPI over the hold.
Questions for the listing agent
- What do current leases actually rent for vs. the listed asking? Can we see a recent rent roll and the last 12 months of T-12 income?
- Built in 1964 — when were the roof, HVAC, electrical panel, plumbing, and water heater last replaced?
- Is there a deadline driving the sale (1031 exchange, divorce, estate, relocation)? That informs how much negotiation room exists.
- Schools are D-rated, which usually means shorter tenancies and higher turnover. Who's the typical renter profile here, and what's been the actual vacancy rate?
- The area grade is low — what's the realistic commute time and amenity access for the typical tenant pool here? Any planned neighborhood developments (good or bad) we should know about?
- What's the average days-on-market for RENTAL listings here right now (not sales)? A rising rental-DOM trend means longer vacancies and softer asking-rent achievability than the comps imply.
- What's the recent tenant-quality profile in this submarket — average credit score on applications, eviction rate, late-payment / NSF rate, and stable-employment percentage? A property-management company in the area should have these aggregated.
- How much new for-sale + rental construction is in the pipeline within 1–3 miles? Heavy new supply typically softens prices + rents 12–24 months out; constrained supply supports both.
Investment metrics
- 1% rule
- 0.90% ✗
- Cap rate
- 6.18%
- Cash-on-cash
- -0.39%
- DSCR
- 0.98
- GRM
- 9.3
CMA / ARV
- ARV (on-the-fly)
- $362,400
- Comps found
- 12
Show comp detail 12 sales within ~0.75 mi
| Address | Dist | Beds/Ba | Sqft | Sold | Price | $/sf | Match |
|---|---|---|---|---|---|---|---|
| 62 Highland Dr | 0.25mi | 3/1.0 | 1,200 (0%) | 2mo | $373,000 | $311 | 87 |
| 50 Highland Dr | 0.17mi | 3/1.0 | 1,200 (0%) | 10mo | $325,000 | $271 | 84 |
| 12 Cartridge Trl | 0.05mi | 3/1.5 | 1,028 (-14%) | 6mo | $319,000 | $310 | 67 |
| 61 Town Farm Rd | 0.35mi | 3/1.5 | 1,301 (+8%) | 6mo | $335,000 | $257 | 62 |
| 5 Sachem Ln | 0.49mi | 3/1.5 | 1,104 (-8%) | 6mo | $333,000 | $302 | 57 |
| 4 Chestnut Ln | 0.28mi | 4/2.0 (+1) | 1,268 (+6%) | 16mo | $350,000 | $276 | 55 |
| 14 Pennywise Ln | 0.42mi | 3/1.5 | 1,040 (-13%) | 2mo | $365,000 | $351 | 54 |
| 25 Meetinghouse Ln | 0.30mi | 3/1.5 | 1,328 (+11%) | 15mo | $345,000 | $260 | 54 |
| 24 Blacksmith Dr | 0.13mi | 3/2.0 | 1,028 (-14%) | 22mo | $365,000 | $355 | 48 |
| 4 Model Park Rd | 0.36mi | 3/1.5 | 1,028 (-14%) | 18mo | $349,900 | $340 | 43 |
| 20 Cliff Rd | 0.42mi | 2/2.0 (-1) | 1,372 (+14%) | 12mo | $230,000 | $168 | 38 |
| 12 Boulder Way | 0.42mi | 2/2.0 (-1) | 1,370 (+14%) | 16mo | $225,000 | $164 | 35 |
Match score weights: distance 35% · size 25% · config 20% · recency 20%. Top-matched comps best support the ARV.
Projected returns pro-forma
-3.0% appreciation · 3.0% rent growth · sell at horizon
- IRR
- -16.9%
- Equity multiple
- 0.40×
- Total profit
- $-40,013
- Equity at exit
- $35,621
- IRR
- -8.7%
- Equity multiple
- 0.46×
- Total profit
- $-36,311
- Equity at exit
- $20,656
Cash invested: $66,892 (down + closing). Projections, not guarantees.
Landlord ↔ Tenant lean methodology
- Overall (STATE)
- 27 Tenant-Leaning
- State Connecticut
- 27 Tenant-Leaning · D+7
- County
- — inherits STATE
- City
- — inherits STATE
ZIP-level market 06339
- Home prices YoY
- -19.4%
- Active inventory
- 36
- Price-to-rent
- 9.3×
Monthly cashflow live
- Estimated rent
- $2,150 medium interval (Pro) →
- Mortgage (P&I)
- −$1,253
- Tax from tax record
- −$368 /mo · $4,413/yr
- Insurance
- −$100
- HOA
- −$0
- Vacancy / Maint / Mgmt
- −$452
- Net cashflow
- $-22
Break-even live
UW: 25.0% down · 7.5% · 30yr · 1.5% tax · 5.0% vac · 8.0% maint · 8.0% mgmt
Financing live
Cash to close
- Down payment
- $59,725
- Closing costs
- $7,167
- Reserves months
- —
- Total cash needed
- —
Loan-product check · same deal, 3 products live
Conventional
25% down · 7.5% · 30yr
- Down + closing
- —
- Monthly P&I
- —
- Monthly cashflow
- —
- DSCR
- —
- Eligible?
- —
Personal DTI + credit; lowest rate.
DSCR
20% down · 8.5% · 30yr
- Down + closing
- —
- Monthly P&I
- —
- Monthly cashflow
- —
- DSCR
- —
- Eligible?
- —
No personal income docs; deal must DSCR.
Hard money
10% down · 12.0% · 12mo
- Down + closing
- —
- Monthly P&I
- —
- Monthly cashflow
- —
- DSCR
- —
- Eligible?
- —
Short-term bridge; refi at stabilization.
Rent comps 1 comps
| Address | Beds | Baths | Sqft | Rent | $/sqft | DOM | Units | Dist |
|---|---|---|---|---|---|---|---|---|
| 50 Town Farm Rd Unit A Ledyard, CT | 2.0 | 1.5 | 1100 | $2,150 | $1.95 | 11d | 1 | 0.25mi |
Listing history 8 events
-
2026-04-10status Under Contract
-
2026-04-03$238,900 Active
-
2000-11-01soldstatus $102,500
-
2000-10-31soldstatus $102,500 194-char remark
Show marketing remark (194 chars)
Great value in this efficient ranch home - fully applianced kitchen - large level yard - new shed - neat and clean! A pleasure to show - room off kitchen suitable for dining room or family room.
-
2000-06-07$105,000 194-char remark
Show marketing remark (194 chars)
Great value in this efficient ranch home - fully applianced kitchen - large level yard - new shed - neat and clean! A pleasure to show - room off kitchen suitable for dining room or family room.
-
1999-03-01soldstatus $90,000 74-char remark
Show marketing remark (74 chars)
Air conditioner stay-drapes-tub enclosure will be replaced before closing.
-
1999-03-01soldstatus $90,000
Show marketing remark (74 chars)
Air conditioner stay-drapes-tub enclosure will be replaced before closing.
-
1999-01-16$93,500 74-char remark
Show marketing remark (74 chars)
Air conditioner stay-drapes-tub enclosure will be replaced before closing.
ⓘ Source: listings_history table (triggers on properties + properties_extension) + one-shot
backfill from property_details.listing_events for pre-trigger history.
Tax reassessment forecast CT · Partial reset (capped growth)
- Current annual tax
- $4,413 · $368/mo
- Projected year-2 tax
- $4,763 · $397/mo
- Expected delta
- +$350/yr (+$29/mo · 7.9%)
ⓘ Screening estimate from a state-policy table — verify with the county assessor before closing.
Climate risk First Street
- Flood 1/10 Low FEMA zone X (unshaded) · 0% chance over 30 yrs
- Wildfire 3/10 Moderate
- Heat 5/10 Major 7 d/yr ≥94°F today · 16 d/yr by 30 yrs out
- Wind 7/10 Severe 78% chance of damaging wind over 30 yrs
- Air quality 3/10 Moderate 2 unhealthy d/yr today · 3 by 30 yrs out
Nearby sold comps map
Loading sold comps map…
Walkable amenities ~0.75 mi
Loading nearby amenities…
Taxation est. · year 1
- Rental income
- $25,800
- − Mortgage interest
- −$13,382
- − Property taxes
- −$4,413
- − Insurance
- −$1,194
- − Repairs & maintenance
- −$2,064
- − Management
- −$2,064
- − Depreciation
- −$6,950
- Taxable loss
- −$4,267
- Est. tax savings @ 24.0%
- +$1,024
- After-tax cash flow
- $765/yr
For passive investors: Depreciation is non-cash, so a rental often shows a tax loss while cash-flowing — sheltering income. Rental losses are passive: they offset passive income freely, and up to $25,000/yr can offset ordinary (W-2) income if you actively participate and your MAGI is under $100k (phasing out to $0 by $150k); unused losses carry forward. On sale, claimed depreciation is recaptured at up to 25%, and gains may owe capital-gains tax (a 1031 exchange can defer both). Figures are a year-1 estimate at your 24.0% rate — not tax advice; consult a CPA.
Schools (NCES district)
- District
- Ledyard School District
- NCES district ID
- 0902160
- Math proficiency
- 34% ▼ -12.00%
- Reading proficiency
- 49% ▼ -6.00%
- Median HH income
- $84,854
- Composite
- 39.02/100
- National rank
- #4064
- State rank
- #92 of 153 in CT
Livability — Mashantucket
- Score
- 71/100
- State rank
- #89
- US rank
- #6996
Category grades
Schools grade is shown separately in the Schools card above.
Census & demographics
- City population
- 62
- Population (ZIP)
- 9,263
Population outlook (Southeastern Connecticut County) Hauer SSP2
- By 2040
- 293,442
Race, ethnicity, and origin ACS 2023
- Neighborhood character
- Predominantly White (80%)
- Race & ethnicity
- White 80% Hispanic / Latino 9% Two or more races 6% Asian 3% Black 2% Native American 1%
- Hispanic origin (detail)
- Mexican 1% Puerto Rican 5%
- Common ancestry
- Romanian 4% Italian 2% Lithuanian 2%
- Foreign-born
- 5% · Canada, China, Jamaica
- Languages at home
- 91% English-only · Spanish 5% Chinese 2% Russian/Polish/Slavic 1%
Political lean MEDSL · Southeastern Connecticut
- 2024 margin
- D (+13.0) · D 55.6% · R 42.6% · Other 1.8%
- All cycles
- 2024: D+13.0
Not yet ingested
- Civics
- —
Market trends
- HPI YoY
- ▼ -61.39%
- Current HPI
- 255.764
- Rent YoY
- —
- Metro
- —
- State GDP YoY
- ▲ 1.06%
- F500 in state
- 38
Industry mix (Fortune 500 HQ in CT)
| Industry | F500 HQs | Revenue |
|---|---|---|
| Industrial Machinery | 4 | $38B |
|
||
| Insurance | 3 | $71B |
|
||
| Financial Services | 2 | $25B |
|
||
| Transportation / Logistics | 2 | $18B |
|
||
| Healthcare | 1 | $247B |
|
||
| Telecommunications | 1 | $55B |
|
||
Price history
+155.5% since first listed8 events — show timeline
- 2026-04-10 Pending — Smart MLS
- 2026-04-03 Listed $238,900 Smart MLS
- 2000-11-01 Sold (Public Records) $102,500 Public Records
- 2000-10-31 Sold (MLS) $102,500 Smart MLS
- 2000-06-07 Listed $105,000 Smart MLS
- 1999-03-01 Sold (Public Records) $90,000 Public Records
- 1999-03-01 Sold (MLS) $90,000 Smart MLS
- 1999-01-16 Listed $93,500 Smart MLS
Property tax history
+3.4%/yrLatest (2023): $4,413 · +2.2% YoY. Source: county tax records.
Cash-flow waterfall
monthlySold comps — $/sqft
last 12 mo · ≤1 miLoading sold comps…