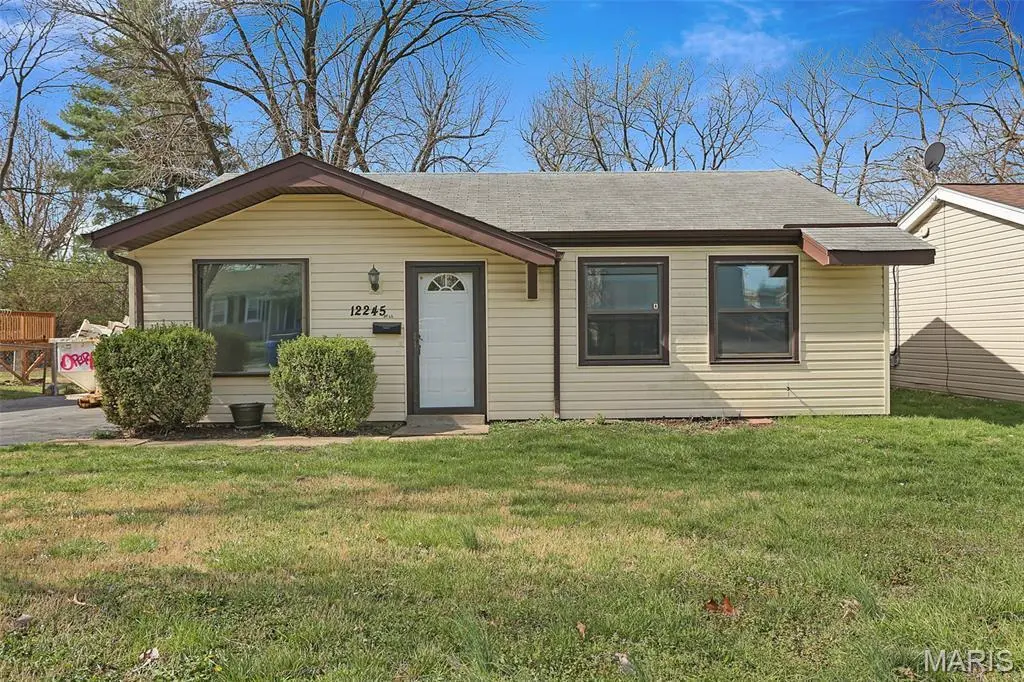
12245 Bennington Pl
Maryland Heights, MO 63043
$219,900D+
3 bd · 1.0 ba ·
1,400 sqft ·
Built 1961
· SingleFamily
· Pending
· 9 DOM
Cashflow @ list (25.0% down · 7.5%)
Estimated rent
$1,859/mo
Mortgage (P&I)
−$1,153
Tax + insurance
−$290
HOA
−$0
Vac / Maint / Mgmt
−$390
Net cashflow
$26/mo
Annual
$309/yr
Cap rate
6.43%
Cash-on-cash
0.50%
DSCR
1.02
1% rule
0.85%
Cash to close
$61,572
Investor read
- This is a 3-bed/1.0-bath single-family listed at $220k.
- At list price, monthly cash flow is $26 ($309/yr) — positive.
- The deal already cash-flows at list — no discount required.
- To meet the 1% rule (rent ≥ 1% of price), the offer needs to be $186k (15.4% below list).
- Only 9 days on market — expect competitive offers; lowballing is unlikely to land.
- Recommended offer: $186k (15.4% below list) — sets the bar for 1% rule.
- Local home prices are declining (-3.0%/yr); year-one equity from $2k of loan paydown is wiped out by about $7k of value loss. Plan a longer hold.
- Location reads 71/100 on livability (#101 in MO) — a middle-class / working-renter tenant base. Strengths: cost of living A+, housing A+, crime A-; Watch: health & safety C-, amenities F, commute F.
- Pattonville R-III (suburban): math 32% / reading 46% proficiency, ranked #147 of 324 in MO (top 45%) — families likely to look elsewhere, expect single-tenant / working-renter base with shorter leases.
- Zoned schools: Rose Acres Elem. (math 62% / reading 67%, grade B, #70 of 1,115 statewide, top 8%, 350 students, 28% FRL); Pattonville Sr. High (math 33% / reading 64%, grade D, #147 of 521 statewide, top 29%, 1,893 students, 39% FRL) — zoned schools at 34% FRL track the district average.
- Zoned-school proficiency averages 56% at this address vs 39% district-wide (+18 pts) — the actual schools serving this property are materially stronger than the Pattonville R-III average implies; a family-tenant draw the district grade alone would hide.
- Market conditions: Rents rising (+1.6%/yr); 105 active listings in the ZIP; 3 comparable units currently listed for rent nearby; rentals lingering (median 44d on market — plan ~5-8 weeks vacancy on turnover, expect pricing pressure); 67% of comp listings sitting > 30 days — soft ceiling on asking rent; solid renter incomes; 920 units permitted in St. Louis County in 2024 (250 in 5+ unit buildings).
- Current owner paid $124k; list at $220k implies a 78% gain — meaningful room to come down on a strong offer.
- Cap rate 6.4% vs local median 4.3% in Maryland Heights — top-decile yield for the area; either an underpriced asset or a hidden risk that comps aren't pricing in. Stress-test before assuming the spread holds.
Questions for listing agent
- Built in 1961 — when were the roof, HVAC, electrical panel, plumbing, and water heater last replaced?
- Is there a deadline driving the sale (1031 exchange, divorce, estate, relocation)? That informs how much negotiation room exists.
- Schools are B-rated — typically a magnet for longer-tenancy family renters. What's the average tenant stay here, and is there a school-zone premium baked into asking?
- The area grade is low — what's the realistic commute time and amenity access for the typical tenant pool here? Any planned neighborhood developments (good or bad) we should know about?
- What's the average days-on-market for RENTAL listings here right now (not sales)? A rising rental-DOM trend means longer vacancies and softer asking-rent achievability than the comps imply.
- What's the recent tenant-quality profile in this submarket — average credit score on applications, eviction rate, late-payment / NSF rate, and stable-employment percentage? A property-management company in the area should have these aggregated.
- How much new for-sale + rental construction is in the pipeline within 1–3 miles? Heavy new supply typically softens prices + rents 12–24 months out; constrained supply supports both.
CashFlowRE · CFR-KBKJEP7MR17R7N
· Data 3 weeks ago
cashflowre.app · 2026-05-29