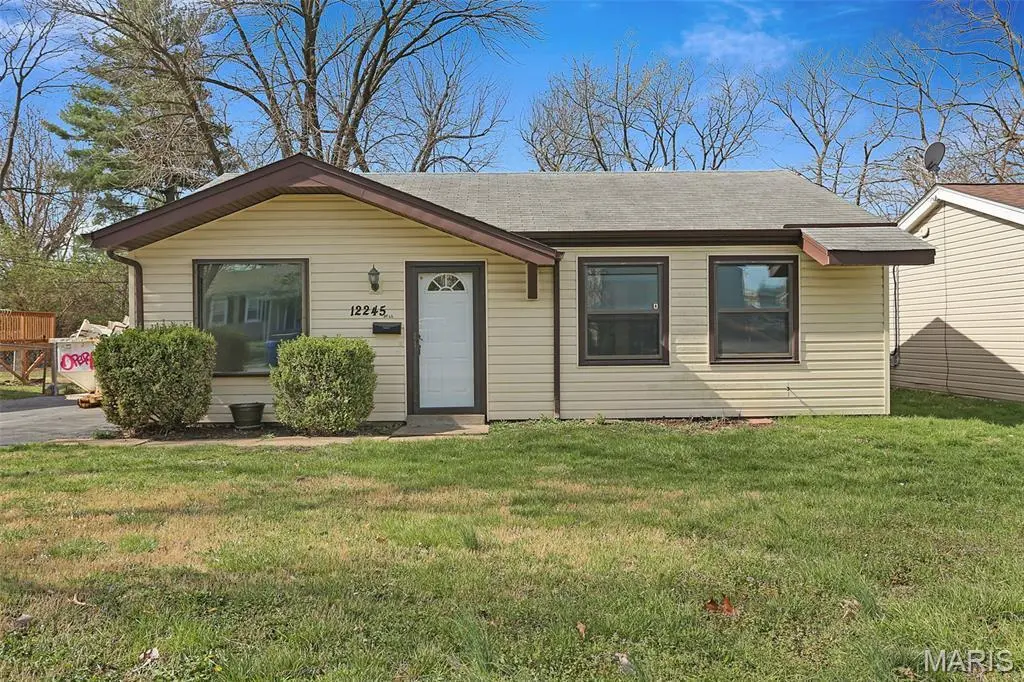
12245 Bennington Pl · Maryland Heights, MO
Flood risk 1/10 · Minimal
- FEMA flood zone
- X (unshaded)
- Chance of flooding over 30 yrs
- 0.0%
- Est. flood insurance / yr
- $507 – $1,088
Fire risk 1/10 · Minimal
- Est. fire insurance / yr
- $1,054 – $1,958
Heat risk 4/10 · Minor
- Hot days now (above 106°F)
- 7 days/yr
- Hot days in 30 yrs
- 21 days/yr
Wind risk 2/10 · Minimal
- Chance of severe wind over 30 yrs
- 1.0%
Air-quality risk 2/10 · Minimal
- Unhealthy air days now
- 2 days/yr
- Unhealthy air days in 30 yrs
- 2 days/yr
Risk factors via First Street. Map © Google.
Why this score? — see what drove the D+ grade
The composite is a weighted blend of 9 inputs, each scored 0–100. Each bar is that input's sub-score; the figure is the points it added to the 100-point composite (weight × sub-score).
- ARV discount +15.0/15.0
- Cash flow +13.9/30.0
- DSCR +4.2/10.0
- Livability +3.6/5.0
- 1% rule +3.5/10.0
- Schools +3.4/10.0
- Rent growth +2.9/5.0
- Condition / age +2.5/5.0
- Appreciation +0.0/10.0
$219,900
🖨 Deal sheet 📄 Offer letter ✓ Due diligence
Listing remarks
Welcome to 12245 Bennington Place in Maryland Heights—a beautifully well-kept and updated 3-bedroom, 1-bath ranch offering approximately 1,400 sq. ft. of comfortable living space. The home features a spacious 26x16 great room with a cozy fireplace and a sliding glass door that opens to a deck, creating an inviting space for both relaxing and entertaining. Inside, you’ll find a blend of ceramic flooring and new carpet, new stainless steel appliances in the kitchen, and the added convenience of main floor laundry. Additional highlights include thermal tilt-in windows for energy efficiency and easy maintenance, as well as a double driveway providing ample parking. The generous yard
Key facts
- 8,158 sq ft lot
- Built 1961
- Listed 9 days
Neighborhood map
What this means for you Summary
Snapshot
- This is a 3-bed/1.0-bath single-family listed at $220k.
Deal economics
- At list price, monthly cash flow is $26 ($309/yr) — positive.
- The deal already cash-flows at list — no discount required.
- To meet the 1% rule (rent ≥ 1% of price), the offer needs to be $186k (15.4% below list).
- Recommended offer: $186k (15.4% below list) — sets the bar for 1% rule.
- Cap rate 6.4% vs local median 4.3% in Maryland Heights — top-decile yield for the area; either an underpriced asset or a hidden risk that comps aren't pricing in. Stress-test before assuming the spread holds.
Location & tenants
- Location reads 71/100 on livability (#101 in MO) — a middle-class / working-renter tenant base. Strengths: cost of living A+, housing A+, crime A-; Watch: health & safety C-, amenities F, commute F.
- Pattonville R-III (suburban): math 32% / reading 46% proficiency, ranked #147 of 324 in MO (top 45%) — families likely to look elsewhere, expect single-tenant / working-renter base with shorter leases.
- Zoned schools: Rose Acres Elem. (math 62% / reading 67%, grade B, #70 of 1,115 statewide, top 8%, 350 students, 28% FRL); Pattonville Sr. High (math 33% / reading 64%, grade D, #147 of 521 statewide, top 29%, 1,893 students, 39% FRL) — zoned schools at 34% FRL track the district average.
- Zoned-school proficiency averages 56% at this address vs 39% district-wide (+18 pts) — the actual schools serving this property are materially stronger than the Pattonville R-III average implies; a family-tenant draw the district grade alone would hide.
- Market conditions: Rents rising (+1.6%/yr); 105 active listings in the ZIP; 3 comparable units currently listed for rent nearby; rentals lingering (median 44d on market — plan ~5-8 weeks vacancy on turnover, expect pricing pressure); 67% of comp listings sitting > 30 days — soft ceiling on asking rent; solid renter incomes; 920 units permitted in St. Louis County in 2024 (250 in 5+ unit buildings).
Forward outlook
- Local home prices are declining (-3.0%/yr); year-one equity from $2k of loan paydown is wiped out by about $7k of value loss. Plan a longer hold.
Negotiation context
- Only 9 days on market — expect competitive offers; lowballing is unlikely to land.
- Current owner paid $124k; list at $220k implies a 78% gain — meaningful room to come down on a strong offer.
Questions for the listing agent
- Built in 1961 — when were the roof, HVAC, electrical panel, plumbing, and water heater last replaced?
- Is there a deadline driving the sale (1031 exchange, divorce, estate, relocation)? That informs how much negotiation room exists.
- Schools are B-rated — typically a magnet for longer-tenancy family renters. What's the average tenant stay here, and is there a school-zone premium baked into asking?
- The area grade is low — what's the realistic commute time and amenity access for the typical tenant pool here? Any planned neighborhood developments (good or bad) we should know about?
- What's the average days-on-market for RENTAL listings here right now (not sales)? A rising rental-DOM trend means longer vacancies and softer asking-rent achievability than the comps imply.
- What's the recent tenant-quality profile in this submarket — average credit score on applications, eviction rate, late-payment / NSF rate, and stable-employment percentage? A property-management company in the area should have these aggregated.
- How much new for-sale + rental construction is in the pipeline within 1–3 miles? Heavy new supply typically softens prices + rents 12–24 months out; constrained supply supports both.
Investment metrics
- 1% rule
- 0.85% ✗
- Cap rate
- 6.43%
- Cash-on-cash
- 0.50%
- DSCR
- 1.02
- GRM
- 9.9
CMA / ARV
- ARV (on-the-fly)
- $274,400
- Comps found
- 12
Show comp detail 12 sales within ~0.75 mi
| Address | Dist | Beds/Ba | Sqft | Sold | Price | $/sf | Match |
|---|---|---|---|---|---|---|---|
| 12245 Bennington Pl | 0.00mi | 3/1.0 | 1,400 (0%) | 0mo | $219,900 | $157 | 100 |
| 12157 Belaire Pl | 0.20mi | 3/1.0 | 1,383 (-1%) | 4mo | $225,000 | $163 | 85 |
| 2574 Creve Coeur Mill Rd | 0.13mi | 2/1.5 (-1) | 1,368 (-2%) | 8mo | $200,000 | $146 | 76 |
| 12121 Glenpark Dr | 0.51mi | 3/2.0 | 1,332 (-5%) | 4mo | $275,000 | $206 | 60 |
| 12006 Glengrove Dr | 0.38mi | 3/1.5 | 1,516 (+8%) | 10mo | $274,900 | $181 | 58 |
| 12068 Charleston Dr | 0.74mi | 3/1.5 | 1,400 (0%) | 7mo | $229,900 | $164 | 58 |
| 11947 Glenmar Dr | 0.51mi | 4/2.0 (+1) | 1,466 (+5%) | 6mo | $269,900 | $184 | 54 |
| 12021 Glenbrook Dr | 0.41mi | 3/2.0 | 1,190 (-15%) | 8mo | $249,000 | $209 | 45 |
| 12085 Washington Ct | 0.69mi | 3/4.5 | 1,380 (-1%) | 9mo | $270,000 | $196 | 44 |
| 2988 Joyce Ct | 0.72mi | 4/2.5 (+1) | 1,430 (+2%) | 10mo | $299,000 | $209 | 44 |
| 11818 Smoke Rise Ct | 0.74mi | 3/2.5 | 1,272 (-9%) | 6mo | $250,000 | $197 | 39 |
| 11817 Smoke Rise Ct | 0.72mi | 3/2.0 | 1,219 (-13%) | 9mo | $280,000 | $230 | 33 |
Match score weights: distance 35% · size 25% · config 20% · recency 20%. Top-matched comps best support the ARV.
Projected returns pro-forma
-3.0% appreciation · 1.6% rent growth · sell at horizon
- IRR
- -17.0%
- Equity multiple
- 0.41×
- Total profit
- $-36,597
- Equity at exit
- $32,788
- IRR
- -11.6%
- Equity multiple
- 0.35×
- Total profit
- $-40,142
- Equity at exit
- $19,013
Cash invested: $61,572 (down + closing). Projections, not guarantees.
Landlord ↔ Tenant lean methodology
- Overall (STATE)
- 81 Strongly Landlord-Friendly
- State Missouri
- 81 Strongly Landlord-Friendly · R+10
- County
- — inherits STATE
- City
- — inherits STATE
ZIP-level market 63043
- Rents YoY
- 1.6%
- Active inventory
- 105
- Price-to-rent
- 9.9×
Monthly cashflow live
- Estimated rent
- $1,859 medium interval (Pro) →
- Mortgage (P&I)
- −$1,153
- Tax from tax record
- −$198 /mo · $2,381/yr
- Insurance
- −$92
- HOA
- −$0
- Vacancy / Maint / Mgmt
- −$390
- Net cashflow
- $26
Break-even live
UW: 25.0% down · 7.5% · 30yr · 1.5% tax · 5.0% vac · 8.0% maint · 8.0% mgmt
Financing live
Cash to close
- Down payment
- $54,975
- Closing costs
- $6,597
- Reserves months
- —
- Total cash needed
- —
Loan-product check · same deal, 3 products live
Conventional
25% down · 7.5% · 30yr
- Down + closing
- —
- Monthly P&I
- —
- Monthly cashflow
- —
- DSCR
- —
- Eligible?
- —
Personal DTI + credit; lowest rate.
DSCR
20% down · 8.5% · 30yr
- Down + closing
- —
- Monthly P&I
- —
- Monthly cashflow
- —
- DSCR
- —
- Eligible?
- —
No personal income docs; deal must DSCR.
Hard money
10% down · 12.0% · 12mo
- Down + closing
- —
- Monthly P&I
- —
- Monthly cashflow
- —
- DSCR
- —
- Eligible?
- —
Short-term bridge; refi at stabilization.
Rent comps 3 comps
| Address | Beds | Baths | Sqft | Rent | $/sqft | DOM | Units | Dist |
|---|---|---|---|---|---|---|---|---|
| 2657 McKelvey Rd Maryland Heights, MO | 3.0 | 2.0 | 962 | $1,895 | $1.97 | 24d | 1 | 0.71mi |
| 11918 Brookmont Dr Maryland Heights, MO | 3.0 | 1.0 | 980 | $1,800 | $1.84 | 44d | 1 | 0.99mi |
| 2302 Canyonlands Dr Unit E Maryland Heights, MO | 3.0 | 2.0 | 1442 | $1,800 | $1.25 | 44d | 1 | 1.41mi |
Listing history 4 events
-
2026-04-05status Pending
-
2026-03-27$219,900 Active
-
2026-03-24historical $219,900
-
2003-08-19soldstatus $123,500
ⓘ Source: listings_history table (triggers on properties + properties_extension) + one-shot
backfill from property_details.listing_events for pre-trigger history.
Tax reassessment forecast MO · Resets to sale price
- Current annual tax
- $2,381 · $198/mo
- Projected year-2 tax
- $2,381 · $198/mo
- Expected delta
- $0/yr ($0/mo · 0.0%)
ⓘ Screening estimate from a state-policy table — verify with the county assessor before closing.
Climate risk First Street
- Flood 1/10 Low FEMA zone X (unshaded) · 0% chance over 30 yrs
- Wildfire 1/10 Low
- Heat 4/10 Moderate 7 d/yr ≥106°F today · 21 d/yr by 30 yrs out
- Wind 2/10 Low 100% chance of damaging wind over 30 yrs
- Air quality 2/10 Low 2 unhealthy d/yr today · 2 by 30 yrs out
Nearby sold comps map
Loading sold comps map…
Walkable amenities ~0.75 mi
Loading nearby amenities…
Taxation est. · year 1
- Rental income
- $22,313
- − Mortgage interest
- −$12,318
- − Property taxes
- −$2,381
- − Insurance
- −$1,100
- − Repairs & maintenance
- −$1,785
- − Management
- −$1,785
- − Depreciation
- −$6,397
- Taxable loss
- −$3,452
- Est. tax savings @ 24.0%
- +$829
- After-tax cash flow
- $1,137/yr
For passive investors: Depreciation is non-cash, so a rental often shows a tax loss while cash-flowing — sheltering income. Rental losses are passive: they offset passive income freely, and up to $25,000/yr can offset ordinary (W-2) income if you actively participate and your MAGI is under $100k (phasing out to $0 by $150k); unused losses carry forward. On sale, claimed depreciation is recaptured at up to 25%, and gains may owe capital-gains tax (a 1031 exchange can defer both). Figures are a year-1 estimate at your 24.0% rate — not tax advice; consult a CPA.
Schools (NCES district)
- District
- Pattonville R-III
- NCES district ID
- 2923700
- Math proficiency
- 32% ▼ -11.00%
- Reading proficiency
- 46% ▼ -5.00%
- Median HH income
- $50,786
- Composite
- 33.69/100
- National rank
- #5383
- State rank
- #147 of 324 in MO
Livability — Maryland Heights
- Score
- 71/100
- State rank
- #101
- US rank
- #6808
Category grades
Schools grade is shown separately in the Schools card above.
Census & demographics
- Census place
- Maryland Heights, MO
- County
- Saint Louis County · 888,823 people
- City population
- 21,924
- Metro
- St. Louis, MO-IL
- Population (ZIP)
- 21,924
- Household income
- $91,509
- Rent vs Own
- Severe rent burden
- 277.0
Population outlook (St. Louis County) Hauer SSP2
- Today (2025)
- 1,025,227 people
- By 2030
- 1,028,023 · +0.3%
- By 2040
- 1,020,940 · -0.4%
- By 2050
- 1,007,280 · -1.8%
- By 2075
- 987,277 · -3.7%
- By 2100
- 921,984 · -10.1%
Race, ethnicity, and origin ACS 2023
- Neighborhood character
- Diverse neighborhood (Simpson 0.58)
- Race & ethnicity
- White 62% Black 14% Asian 14% Two or more races 6% Hispanic / Latino 5%
- Common ancestry
- Lithuanian 4% Slovak 3% French 2%
- Foreign-born
- 18% · Canada, China, Vietnam
- Languages at home
- 78% English-only · Other Asian/Pacific 7% Spanish 5% Other Indo-European 4%
Political lean MEDSL · St. Louis
- 2024 margin
- Strong D (+23.4) · D 60.8% · R 37.4% · Other 1.7%
- 2008→2024 swing
- +3.5pp toward D · 2008: 19.9pp · 2024: 23.4pp
- All cycles
- 2024: D+23.4 2020: D+24.0 2016: D+16.2 2012: D+13.7 2008: D+19.9
Not yet ingested
- Civics
- —
Market trends
- HPI YoY
- ▼ -307.48%
- Current HPI
- 218.599
- Rent YoY
- ▲ 1.60%
- Metro
- St. Louis, MO-IL
- State GDP YoY
- ▲ 1.84%
- F500 in state
- 20
Industry mix (Fortune 500 HQ in MO)
| Industry | F500 HQs | Revenue |
|---|---|---|
| Healthcare | 1 | $163B |
|
||
| Insurance | 1 | $21B |
|
||
| Industrial Technology | 1 | $17B |
|
||
| Retail | 1 | $16B |
|
||
| Industrial Distribution | 1 | $10B |
|
||
| Utilities | 1 | $9B |
|
||
Price history
+78.1% since first listed4 events — show timeline
- 2026-04-05 Pending — MARIS as Distributed by MLS Grid
- 2026-03-27 Listed $219,900 MARIS as Distributed by MLS Grid
- 2026-03-24 Coming Soon $219,900 MARIS as Distributed by MLS Grid
- 2003-08-19 Sold (Public Records) $123,500 Public Records
Property tax history
+1.4%/yrLatest (2022): $2,381 · +1.1% YoY. Source: county tax records.
Cash-flow waterfall
monthlySold comps — $/sqft
last 12 mo · ≤1 miLoading sold comps…