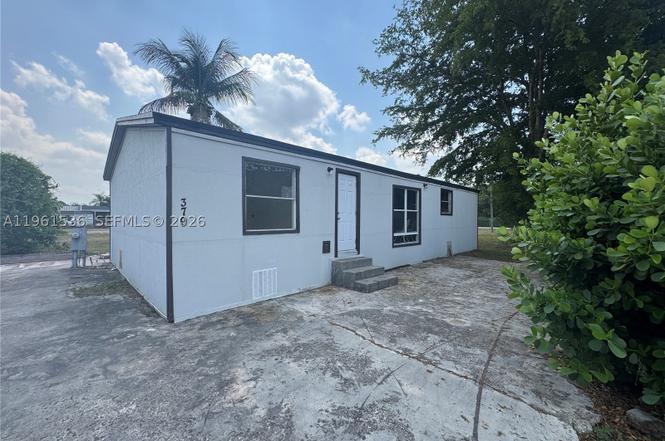
19800 SW 180th Av #379
Richmond West, FL 33187
$195,000C+
2 bd · 2.0 ba ·
1,170 sqft ·
Built 1994
· Condo
· Active
· 130 DOM
Cashflow @ list (25.0% down · 7.5%)
Estimated rent
$2,400/mo
Mortgage (P&I)
−$1,023
Tax + insurance
−$423
HOA
−$184
Vac / Maint / Mgmt
−$504
Net cashflow
$267/mo
Annual
$3,202/yr
Cap rate
8.87%
Cash-on-cash
9.21%
DSCR
1.41
1% rule
1.23%
Cash to close
$54,600
Investor read
- This is a 2-bed/2.0-bath condo listed at $195k.
- At list price, monthly cash flow is $267 ($3k/yr) — positive.
- The deal already cash-flows at list — no discount required.
- Meets the 1% rule at list price ($2k rent vs $195k).
- It's been on market 130 days — a 12% lower offer ($172k) is reasonable based on typical stale-listing flexibility.
- Recommended offer: $172k (12.0% below list) — sets the bar for market timing.
- Local home prices are declining (-3.0%/yr); year-one equity from $1k of loan paydown is wiped out by about $6k of value loss. Plan a longer hold.
- Location reads 68/100 on livability (#495 in FL) — a middle-class / working-renter tenant base. Strengths: housing A+, crime A, employment A; Watch: schools D-, amenities F, cost of living F.
- Miami-Dade (suburban): math 45% / reading 54% proficiency, ranked #40 of 73 in FL (top 55%) — families likely to look elsewhere, expect single-tenant / working-renter base with shorter leases; 64% free/reduced lunch — lower-income household profile, screen leases tightly.
- Watch-outs: flood insurance adds $152/mo.
- Market conditions: 173 active listings in the ZIP; 1 comparable units currently listed for rent nearby; 10,051 units permitted in Miami-Dade County in 2024 (7,758 in 5+ unit buildings).
- Miami-Dade County population projected at +28% by 2050 — long-run rental-demand tailwind backs the buy-and-hold thesis.
- 4 sale attempts since 3y ago; this cycle's ask has dropped $25k (11%) from the opening price — seller is motivated, your offer sets the floor, not the list.
- Current owner paid $120k; list at $195k implies a 63% gain — meaningful room to come down on a strong offer.
- Climate carrying-cost: in FEMA flood zone AH (mandatory federal flood insurance); severe wind risk, 99% chance of damaging wind over 30y; extreme-heat days projected 7→31/yr by 2055 (HVAC capex compounding) — expect insurance premiums to compound above CPI over the hold.
- Cap rate 8.9% vs local median 3.5% in Richmond West — top-decile yield for the area; either an underpriced asset or a hidden risk that comps aren't pricing in. Stress-test before assuming the spread holds.
Questions for listing agent
- It's been on market 130 days. Have you received any prior offers? Is the seller open to a 12% concession, seller financing, or rate buy-down credit?
- What's the actual annual flood-insurance premium (NFIP or private), and is the property in a SFHA with mandatory coverage?
- What does the HOA fee cover, when was the last increase, and are there any pending special assessments or reserve-fund shortfalls?
- Any open or pending special assessments — roof, HVAC, plumbing, elevator, façade? What's the per-unit balance and payoff schedule, and is the seller paying it off at close or rolling it to the buyer?
- Why hasn't it sold? Are there any deal-killer items the seller is aware of (foundation, flood, title, zoning, code violations)?
- Is there a deadline driving the sale (1031 exchange, divorce, estate, relocation)? That informs how much negotiation room exists.
- Schools are D-rated, which usually means shorter tenancies and higher turnover. Who's the typical renter profile here, and what's been the actual vacancy rate?
- What's the average days-on-market for RENTAL listings here right now (not sales)? A rising rental-DOM trend means longer vacancies and softer asking-rent achievability than the comps imply.
CashFlowRE · CFR-KCA2D7E4SYW9B6
· Data 2 days ago
cashflowre.app · 2026-05-29