19800 SW 180th Av #379 · Richmond West, FL
Flood risk 1/10 · Minimal
- FEMA flood zone
- AH
- Chance of flooding over 30 yrs
- 0.0%
- Est. flood insurance / yr
- $1,142 – $2,507
Fire risk 2/10 · Minimal
- Est. fire insurance / yr
- $947 – $1,759
Heat risk 10/10 · Severe
- Hot days now (above 106°F)
- 7 days/yr
- Hot days in 30 yrs
- 31 days/yr
Wind risk 10/10 · Severe
- Chance of severe wind over 30 yrs
- 99.0%
Air-quality risk 2/10 · Minimal
- Unhealthy air days now
- 0 days/yr
- Unhealthy air days in 30 yrs
- 1 days/yr
Risk factors via First Street. Map © Google.
Why this score? — see what drove the C+ grade
The composite is a weighted blend of 9 inputs, each scored 0–100. Each bar is that input's sub-score; the figure is the points it added to the 100-point composite (weight × sub-score).
- Cash flow +24.9/30.0
- DSCR +8.1/10.0
- ARV discount +7.5/15.0
- 1% rule +7.3/10.0
- Schools +4.2/10.0
- Livability +3.4/5.0
- Rent growth +2.5/5.0
- Condition / age +2.5/5.0
- Appreciation +0.0/10.0
$195,000
🖨 Deal sheet 📄 Offer letter ✓ Due diligence
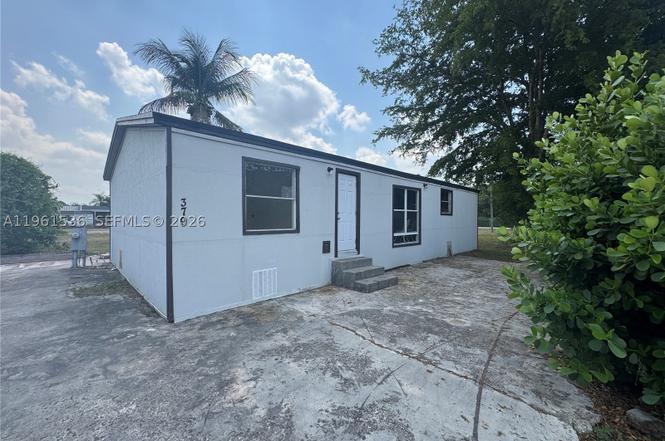
Listing remarks
Three-bedroom, two-bath manufactured home with land ownership included, located in the desirable Americana Village community. Property requires repairs, and the price reflects its current condition—making it the lowest-priced home in the community. Excellent opportunity to update and add value. Conveniently located near the community entrance. Low association fees include water and trash services. Recently reduced for a quick sale.
Key facts
- Laminate flooring
- Low maintenance fees
- 5,090 sq ft lot
Tags
Property features AI
Finance
- HOA & community: Monthly association fee of $184; Community clubhouse; On-site property manager; Community pool (listed under community features)
Exterior
- Parking: Driveway
- Utilities: Public water; Public sewer
- Home design: Single-story; Faces east
- Construction: Resale property
- Exterior features: Fence; Community pool
Interior
- Kitchen: Electric range; Refrigerator
- Bedrooms: Bedroom on main level
- Flooring: Laminate
- Bathrooms: 2 full bathrooms
- Heating & cooling: Central heating; Central air conditioning
- Interior features: First-floor entry; Living/dining room; Bedroom on main level
- Laundry & utility: Electric water heater
Neighborhood map
What this means for you Summary
Snapshot
- This is a 2-bed/2.0-bath condo listed at $195k.
Deal economics
- At list price, monthly cash flow is $267 ($3k/yr) — positive.
- The deal already cash-flows at list — no discount required.
- Meets the 1% rule at list price ($2k rent vs $195k).
- Recommended offer: $172k (12.0% below list) — sets the bar for market timing.
- Cap rate 8.9% vs local median 3.5% in Richmond West — top-decile yield for the area; either an underpriced asset or a hidden risk that comps aren't pricing in. Stress-test before assuming the spread holds.
Location & tenants
- Location reads 68/100 on livability (#495 in FL) — a middle-class / working-renter tenant base. Strengths: housing A+, crime A, employment A; Watch: schools D-, amenities F, cost of living F.
- Miami-Dade (suburban): math 45% / reading 54% proficiency, ranked #40 of 73 in FL (top 55%) — families likely to look elsewhere, expect single-tenant / working-renter base with shorter leases; 64% free/reduced lunch — lower-income household profile, screen leases tightly.
- Market conditions: 173 active listings in the ZIP; 1 comparable units currently listed for rent nearby; 10,051 units permitted in Miami-Dade County in 2024 (7,758 in 5+ unit buildings).
Forward outlook
- Local home prices are declining (-3.0%/yr); year-one equity from $1k of loan paydown is wiped out by about $6k of value loss. Plan a longer hold.
- Miami-Dade County population projected at +28% by 2050 — long-run rental-demand tailwind backs the buy-and-hold thesis.
Negotiation context
- It's been on market 130 days — a 12% lower offer ($172k) is reasonable based on typical stale-listing flexibility.
- 4 sale attempts since 3y ago; this cycle's ask has dropped $25k (11%) from the opening price — seller is motivated, your offer sets the floor, not the list.
- Current owner paid $120k; list at $195k implies a 63% gain — meaningful room to come down on a strong offer.
Risks & watch-outs
- Watch-outs: flood insurance adds $152/mo.
- Climate carrying-cost: in FEMA flood zone AH (mandatory federal flood insurance); severe wind risk, 99% chance of damaging wind over 30y; extreme-heat days projected 7→31/yr by 2055 (HVAC capex compounding) — expect insurance premiums to compound above CPI over the hold.
Questions for the listing agent
- It's been on market 130 days. Have you received any prior offers? Is the seller open to a 12% concession, seller financing, or rate buy-down credit?
- What's the actual annual flood-insurance premium (NFIP or private), and is the property in a SFHA with mandatory coverage?
- What does the HOA fee cover, when was the last increase, and are there any pending special assessments or reserve-fund shortfalls?
- Any open or pending special assessments — roof, HVAC, plumbing, elevator, façade? What's the per-unit balance and payoff schedule, and is the seller paying it off at close or rolling it to the buyer?
- Why hasn't it sold? Are there any deal-killer items the seller is aware of (foundation, flood, title, zoning, code violations)?
- Is there a deadline driving the sale (1031 exchange, divorce, estate, relocation)? That informs how much negotiation room exists.
- Schools are D-rated, which usually means shorter tenancies and higher turnover. Who's the typical renter profile here, and what's been the actual vacancy rate?
- What's the average days-on-market for RENTAL listings here right now (not sales)? A rising rental-DOM trend means longer vacancies and softer asking-rent achievability than the comps imply.
- What's the recent tenant-quality profile in this submarket — average credit score on applications, eviction rate, late-payment / NSF rate, and stable-employment percentage? A property-management company in the area should have these aggregated.
- How much new apartment / multifamily construction is in the pipeline within 1–3 miles? Heavy new supply (>2% of stock underway) typically softens rents 12–24 months out; light construction supports rent growth.
Investment metrics
- 1% rule
- 1.23% ✓
- Cap rate
- 8.87%
- Cash-on-cash
- 9.21%
- DSCR
- 1.41
- GRM
- 6.8
CMA / ARV
No comps found within radius.
Projected returns pro-forma
-3.0% appreciation · 3.0% rent growth · sell at horizon
- IRR
- -7.1%
- Equity multiple
- 0.74×
- Total profit
- $-14,396
- Equity at exit
- $29,075
- IRR
- 2.6%
- Equity multiple
- 1.19×
- Total profit
- $10,196
- Equity at exit
- $16,860
Cash invested: $54,600 (down + closing). Projections, not guarantees.
Landlord ↔ Tenant lean methodology
- Overall (STATE)
- 87 Strongly Landlord-Friendly
- State Florida
- 87 Strongly Landlord-Friendly · R+3
- County
- — inherits STATE
- City
- — inherits STATE
ZIP-level market 33187
- Home prices YoY
- -22.3%
- Active inventory
- 173
- Price-to-rent
- 6.8×
Monthly cashflow live
- Estimated rent
- $2,400 medium interval (Pro) →
- Mortgage (P&I)
- −$1,023
- Tax from tax record
- −$189 /mo · $2,272/yr
- Insurance
- −$81
- Flood insurance flood zone
- −$152 /mo · $1,824/yr
- HOA
- −$184
- Vacancy / Maint / Mgmt
- −$504
- Net cashflow
- $267
Break-even live
UW: 25.0% down · 7.5% · 30yr · 1.5% tax · 5.0% vac · 8.0% maint · 8.0% mgmt
Financing live
Cash to close
- Down payment
- $48,750
- Closing costs
- $5,850
- Reserves months
- —
- Total cash needed
- —
Loan-product check · same deal, 3 products live
Conventional
25% down · 7.5% · 30yr
- Down + closing
- —
- Monthly P&I
- —
- Monthly cashflow
- —
- DSCR
- —
- Eligible?
- —
Personal DTI + credit; lowest rate.
DSCR
20% down · 8.5% · 30yr
- Down + closing
- —
- Monthly P&I
- —
- Monthly cashflow
- —
- DSCR
- —
- Eligible?
- —
No personal income docs; deal must DSCR.
Hard money
10% down · 12.0% · 12mo
- Down + closing
- —
- Monthly P&I
- —
- Monthly cashflow
- —
- DSCR
- —
- Eligible?
- —
Short-term bridge; refi at stabilization.
Rent comps 1 comps
| Address | Beds | Baths | Sqft | Rent | $/sqft | DOM | Units | Dist |
|---|---|---|---|---|---|---|---|---|
| 19800 SW 180th Ave Miami, FL | 2.0–3.0 | 2.0 | 1170 | $2,400 | $2.05 | 24d | 2 | 0.33mi |
HOA detail condo
- Monthly dues
- $184 · $2,208/yr
- Likely covers
- watertrash
- Assessments
- None detected in remarks — confirm with the listing agent.
Listing history 31 events
-
2026-06-18days on market $195,000 Active 130 DOM
-
2026-06-17days on market $195,000 Active 129 DOM
-
2026-06-16days on market $195,000 Active 128 DOM
-
2026-06-15days on market $195,000 Active 127 DOM
-
2026-06-13days on market $195,000 Active 125 DOM
-
2026-06-09days on market $195,000 Active 121 DOM
-
2026-06-08days on market $195,000 Active 120 DOM
-
2026-06-07days on market $195,000 Active 119 DOM
-
2026-06-04days on market $195,000 Active 116 DOM
-
2026-06-03days on market $195,000 Active 115 DOM
-
2026-06-02days on market $195,000 Active 114 DOM
-
2026-06-01days on market $195,000 Active 113 DOM
-
2026-05-31days on market $195,000 Active 112 DOM
-
2026-05-22price $195,000
-
2026-04-17price $200,000
-
2026-02-23price $207,000
-
2026-02-08$220,000 Active
-
2024-11-21historical $2,200
-
2024-10-09price $2,200
-
2024-10-05price $2,300
-
2024-09-17$2,400
-
2023-11-03historical $2,100
-
2023-10-20price $2,100
-
2023-09-16$2,200
-
2023-09-03historical $2,200
-
2023-08-30$2,200
-
2006-04-14soldstatus $119,900
-
1998-09-17soldstatus $55,000
-
1998-01-09soldstatus $63,900
-
1994-01-04soldstatus $10,500
-
1987-01-01soldstatus $28,300
ⓘ Source: listings_history table (triggers on properties + properties_extension) + one-shot
backfill from property_details.listing_events for pre-trigger history.
Tax reassessment forecast FL · Resets to sale price
- Current annual tax
- $2,272 · $189/mo
- Projected year-2 tax
- $2,272 · $189/mo
- Expected delta
- $0/yr ($0/mo · 0.0%)
ⓘ Screening estimate from a state-policy table — verify with the county assessor before closing.
Climate risk First Street
- Flood 1/10 Low FEMA zone AH · 0% chance over 30 yrs
- Wildfire 2/10 Low
- Heat 10/10 Extreme 7 d/yr ≥106°F today · 31 d/yr by 30 yrs out
- Wind 10/10 Extreme 99% chance of damaging wind over 30 yrs
- Air quality 2/10 Low 0 unhealthy d/yr today · 1 by 30 yrs out
Nearby sold comps map
Loading sold comps map…
Walkable amenities ~0.75 mi
Loading nearby amenities…
Taxation est. · year 1
- Rental income
- $28,800
- − Mortgage interest
- −$10,923
- − Property taxes
- −$2,272
- − Insurance
- −$2,800
- − Repairs & maintenance
- −$2,304
- − Management
- −$2,304
- − HOA
- −$2,208
- − Depreciation
- −$5,673
- Taxable income
- $317
- Est. tax owed @ 24.0%
- −$76
- After-tax cash flow
- $3,126/yr
For passive investors: Depreciation is non-cash, so a rental often shows a tax loss while cash-flowing — sheltering income. Rental losses are passive: they offset passive income freely, and up to $25,000/yr can offset ordinary (W-2) income if you actively participate and your MAGI is under $100k (phasing out to $0 by $150k); unused losses carry forward. On sale, claimed depreciation is recaptured at up to 25%, and gains may owe capital-gains tax (a 1031 exchange can defer both). Figures are a year-1 estimate at your 24.0% rate — not tax advice; consult a CPA.
Schools (NCES district)
- District
- Miami-Dade
- NCES district ID
- 1200390
- Math proficiency
- 45% ▼ -16.00%
- Reading proficiency
- 54% ▼ -5.00%
- Median HH income
- $43,928
- Composite
- 41.76/100
- National rank
- #3397
- State rank
- #40 of 73 in FL
Livability — Richmond West
- Score
- 68/100
- State rank
- #495
- US rank
- #9071
Category grades
Schools grade is shown separately in the Schools card above.
Census & demographics
- Population (ZIP)
- 18,575
Population outlook (Miami-Dade County) Hauer SSP2
- Today (2025)
- 3,126,439 people
- By 2030
- 3,325,765 · +6.4%
- By 2040
- 3,697,561 · +18.3%
- By 2050
- 4,012,134 · +28.3%
- By 2075
- 4,605,612 · +47.3%
- By 2100
- 4,866,598 · +55.7%
Race, ethnicity, and origin ACS 2023
- Neighborhood character
- Predominantly Hispanic (80%)
- Race & ethnicity
- Hispanic / Latino 80% Two or more races 36% White 9% Black 6% Asian 2%
- Hispanic origin (detail)
- Mexican 3% Puerto Rican 4% Cuban 42% Dominican 1%
- Common ancestry
- Lithuanian 2% European 1%
- Foreign-born
- 50% · Canada, Jamaica, Dominican Republic
- Languages at home
- 18% English-only · Spanish 80% French/Haitian/Cajun 1%
Political lean MEDSL · Miami-Dade
- 2024 margin
- R (+11.4) · D 43.9% · R 55.4%
- 2008→2024 swing
- -27.6pp toward R · 2008: 16.1pp · 2024: -11.4pp
- All cycles
- 2024: R+11.4 2020: D+7.3 2016: D+29.6 2012: D+23.7 2008: D+16.1
Not yet ingested
- Civics
- —
Market trends
- HPI YoY
- ▼ -133.25%
- Current HPI
- 464.6963
- Rent YoY
- —
- Metro
- —
- State GDP YoY
- ▲ 3.28%
- F500 in state
- 36
Industry mix (Fortune 500 HQ in FL)
| Industry | F500 HQs | Revenue |
|---|---|---|
| Industrial Technology | 2 | $29B |
|
||
| Insurance | 2 | $17B |
|
||
| Retail | 1 | $60B |
|
||
| Technology Distribution | 1 | $58B |
|
||
| Homebuilding | 1 | $35B |
|
||
| Technology Manufacturing | 1 | $35B |
|
||
Price history
+589.0% since first listed18 events — show timeline
- 2026-05-22 Price Changed $195,000 MARMLS
- 2026-04-17 Price Changed $200,000 MARMLS
- 2026-02-23 Price Changed $207,000 MARMLS
- 2026-02-08 Listed $220,000 MARMLS
- 2024-11-21 Rental Removed $2,200 MARMLS
- 2024-10-09 Price Changed $2,200 MARMLS
- 2024-10-05 Price Changed $2,300 MARMLS
- 2024-09-17 Listed for Rent $2,400 MARMLS
- 2023-11-03 Rental Removed $2,100 MARMLS
- 2023-10-20 Price Changed $2,100 MARMLS
- 2023-09-16 Listed for Rent $2,200 MARMLS
- 2023-09-03 Rental Removed $2,200 MARMLS
- 2023-08-30 Listed for Rent $2,200 MARMLS
- 2006-04-14 Sold (Public Records) $119,900 Public Records
- 1998-09-17 Sold (Public Records) $55,000 Public Records
- 1998-01-09 Sold (Public Records) $63,900 Public Records
- 1994-01-04 Sold (Public Records) $10,500 Public Records
- 1987-01-01 Sold (Public Records) $28,300 Public Records
Property tax history
+7.9%/yrLatest (2025): $2,272 · +7.2% YoY. Source: county tax records.
Cash-flow waterfall
monthlySold comps — $/sqft
last 12 mo · ≤1 miLoading sold comps…