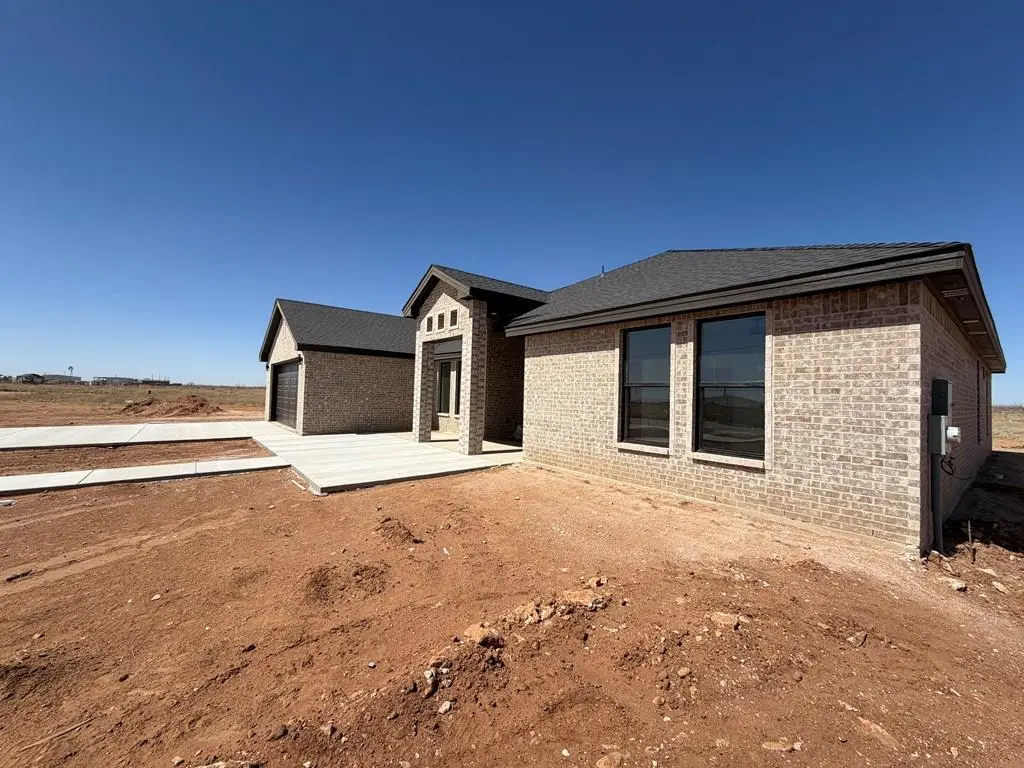
2223 Longhorn Dr
Midland, TX 79782
$650,000C-
4 bd · 3.0 ba ·
2,641 sqft ·
Built 2026
· Land
· Active
· 50 DOM
Cashflow @ list (25.0% down · 7.5%)
Estimated rent
$6,000/mo
Mortgage (P&I)
−$3,409
Tax + insurance
−$1,083
HOA
−$0
Vac / Maint / Mgmt
−$1,260
Net cashflow
$248/mo
Annual
$2,976/yr
Cap rate
6.75%
Cash-on-cash
1.64%
DSCR
1.07
1% rule
0.92%
Cash to close
$182,000
Investor read
- This is a 4-bed/3.0-bath land listed at $650k.
- At list price, monthly cash flow is $248 ($3k/yr) — positive.
- The deal already cash-flows at list — no discount required.
- To meet the 1% rule (rent ≥ 1% of price), the offer needs to be $600k (7.7% below list).
- It's been on market 50 days — a 3% lower offer ($630k) is reasonable based on typical stale-listing flexibility.
- Recommended offer: $600k (7.7% below list) — sets the bar for 1% rule.
- In year one you build about $45k of equity ($4k loan paydown + $41k appreciation (6.3% local appreciation)).
- Location reads 79/100 on livability (#57 in TX, #2,192 nationally) — a middle-class / working-renter tenant base. Strengths: employment A+, housing A+, health & safety A+; Watch: crime C-, commute D+, amenities D.
- Stanton ISD (rural): math 40% / reading 39% proficiency, ranked #426 of 826 in TX (top 52%) — families likely to look elsewhere, expect single-tenant / working-renter base with shorter leases.
- Zoned schools: Stanton El (math 43% / reading 37%, grade F, #1,514 of 4,322 statewide, top 36%, 518 students, 59% FRL); Stanton Middle (math 37% / reading 38%, grade F, #736 of 1,662 statewide, top 45%, 256 students, 54% FRL); Stanton H S (math 44% / reading 47%, grade D-, #630 of 1,632 statewide, top 39%, 307 students, 39% FRL).
- Market conditions: 39 active listings in the ZIP; 1 comparable units currently listed for rent nearby; 5 units permitted in Martin County in 2024 (0 in 5+ unit buildings).
- Martin County population projected at +74% by 2050 — long-run rental-demand tailwind backs the buy-and-hold thesis.
- 2 sale attempts with the ask held roughly flat each time — persistent listings suggest the price (not the market) is what's stuck; bring a comps-based counter.
- At projected returns (6.3% appreciation + 3.0% rent growth), your $182k cash investment doubles in ~4 years — after that, you're playing with house money.
- By year 2, paydown + projected appreciation supports a ~$73k cash-out refi (75% LTV) — recoverable capital for the next deal without selling this one.
- Climate carrying-cost: severe wildfire risk; extreme-heat days projected 7→22/yr by 2055 (HVAC capex compounding) — expect insurance premiums to compound above CPI over the hold.
- Cap rate 6.8% vs local median 4.7% in Midland — top-decile yield for the area; either an underpriced asset or a hidden risk that comps aren't pricing in. Stress-test before assuming the spread holds.
Questions for listing agent
- It's been on market 50 days. Have you received any prior offers? Is the seller open to a 8% concession, seller financing, or rate buy-down credit?
- Is there a deadline driving the sale (1031 exchange, divorce, estate, relocation)? That informs how much negotiation room exists.
- What's the average days-on-market for RENTAL listings here right now (not sales)? A rising rental-DOM trend means longer vacancies and softer asking-rent achievability than the comps imply.
- What's the recent tenant-quality profile in this submarket — average credit score on applications, eviction rate, late-payment / NSF rate, and stable-employment percentage? A property-management company in the area should have these aggregated.
- How much new for-sale + rental construction is in the pipeline within 1–3 miles? Heavy new supply typically softens prices + rents 12–24 months out; constrained supply supports both.
CashFlowRE · CFR-KCTAD02QNW2VPN
· Data 1 day ago
cashflowre.app · 2026-05-29