 🏗️ New Construction
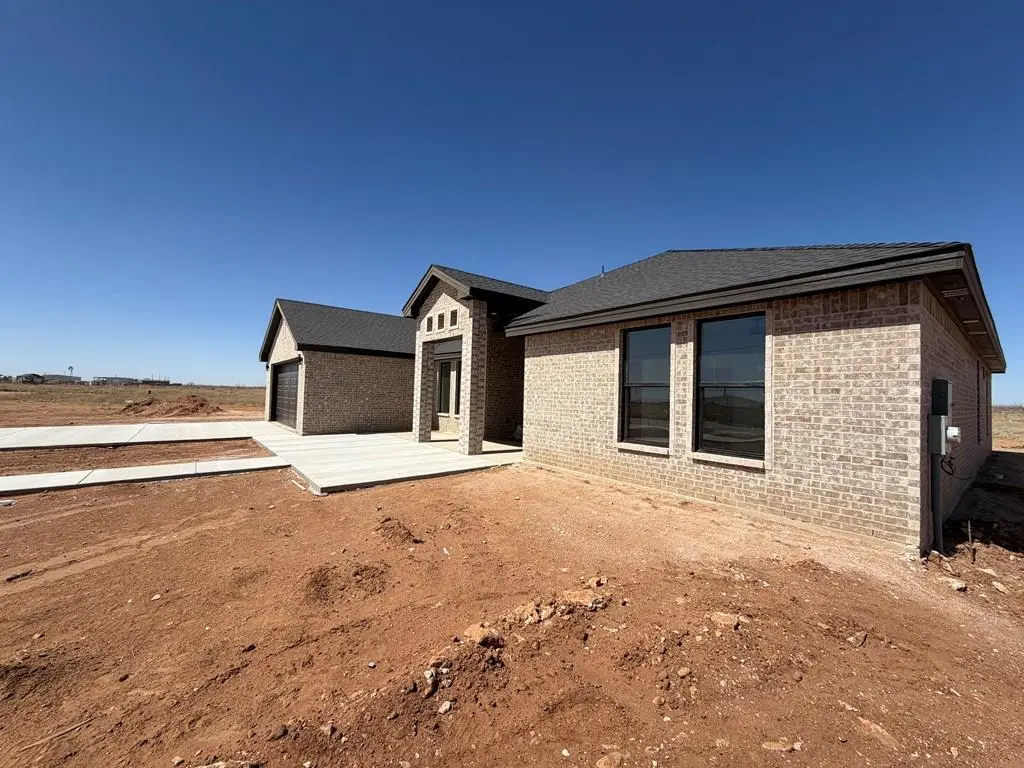
2223 Longhorn Dr · Midland, TX
Flood risk 1/10 · Minimal
- FEMA flood zone
- —
- Chance of flooding over 30 yrs
- 0.0%
- Est. flood insurance / yr
- —
Fire risk 8/10 · Major
- Est. fire insurance / yr
- $1,222 – $2,270
Heat risk 6/10 · Moderate
- Hot days now (above 102°F)
- 7 days/yr
- Hot days in 30 yrs
- 22 days/yr
Wind risk 3/10 · Minor
- Chance of severe wind over 30 yrs
- 5.0%
Air-quality risk 1/10 · Minimal
- Unhealthy air days now
- 0 days/yr
- Unhealthy air days in 30 yrs
- 0 days/yr
Risk factors via First Street. Map © Google.
Why this score? — see what drove the C- grade
The composite is a weighted blend of 9 inputs, each scored 0–100. Each bar is that input's sub-score; the figure is the points it added to the 100-point composite (weight × sub-score).
- Cash flow +15.4/30.0
- Appreciation +8.1/10.0
- ARV discount +7.5/15.0
- DSCR +4.7/10.0
- 1% rule +4.2/10.0
- Livability +4.0/5.0
- Schools +3.4/10.0
- Rent growth +2.5/5.0
- Condition / age +2.5/5.0
$650,000
🖨 Deal sheet 📄 Offer letter ✓ Due diligence
Listing remarks MLS
Do not miss on this beautiful 4 bedroom 3 bathroom new construction home featuring high-end finishes throughout, including solid wood cabinetry, granite countertops, and a blend of tile flooring with plush carpet in bedrooms. Spacious open layout with oversized rooms and a primary suite offering dual (his & hers) closets. Situated on a 1-acre lot with a fenced backyard. 2 car garage custom sized 8x18. Enjoy Midland lifestyle with Stanton taxes! Must tour!
Key facts
- His and hers closets
- Primary suite
- Jack and jill bath
Tags
Property features AI
Finance
- HOA & community: Homeowners association present
Exterior
- Parking: 2 total parking spaces; 2 covered spaces; 2-car garage with garage door opener
- Utilities: Well water; Public sewer; Propane for utilities
- Home design: Single family residence; Residential property; New construction; 1.1-acre lot
- Construction: Composition roof; Slab foundation
- Exterior features: Covered patio/porch; Paved road access; Wind and solar energy generation
Interior
- Kitchen: Electric range; Microwave; Dishwasher; Garbage disposal; Electric water heater
- Flooring: Carpet; Tile
- Bathrooms: 3 full bathrooms; Spa/bath (hot tub/spa present)
- Heating & cooling: Central heating; Central air conditioning
- Interior features: Pantry; High ceilings; Living room fireplace; Therapeutic whirlpool (accessibility feature); Home warranty included
Neighborhood map
What this means for you Summary
Snapshot
- This is a 4-bed/3.0-bath land listed at $650k.
Deal economics
- At list price, monthly cash flow is $248 ($3k/yr) — positive.
- The deal already cash-flows at list — no discount required.
- To meet the 1% rule (rent ≥ 1% of price), the offer needs to be $600k (7.7% below list).
- Recommended offer: $600k (7.7% below list) — sets the bar for 1% rule.
- Cap rate 6.8% vs local median 4.7% in Midland — top-decile yield for the area; either an underpriced asset or a hidden risk that comps aren't pricing in. Stress-test before assuming the spread holds.
Location & tenants
- Location reads 79/100 on livability (#57 in TX, #2,192 nationally) — a middle-class / working-renter tenant base. Strengths: employment A+, housing A+, health & safety A+; Watch: crime C-, commute D+, amenities D.
- Stanton ISD (rural): math 40% / reading 39% proficiency, ranked #426 of 826 in TX (top 52%) — families likely to look elsewhere, expect single-tenant / working-renter base with shorter leases.
- Zoned schools: Stanton El (math 43% / reading 37%, grade F, #1,514 of 4,322 statewide, top 36%, 518 students, 59% FRL); Stanton Middle (math 37% / reading 38%, grade F, #736 of 1,662 statewide, top 45%, 256 students, 54% FRL); Stanton H S (math 44% / reading 47%, grade D-, #630 of 1,632 statewide, top 39%, 307 students, 39% FRL).
- Market conditions: 39 active listings in the ZIP; 1 comparable units currently listed for rent nearby; 5 units permitted in Martin County in 2024 (0 in 5+ unit buildings).
Forward outlook
- In year one you build about $45k of equity ($4k loan paydown + $41k appreciation (6.3% local appreciation)).
- Martin County population projected at +74% by 2050 — long-run rental-demand tailwind backs the buy-and-hold thesis.
- At projected returns (6.3% appreciation + 3.0% rent growth), your $182k cash investment doubles in ~4 years — after that, you're playing with house money.
- By year 2, paydown + projected appreciation supports a ~$73k cash-out refi (75% LTV) — recoverable capital for the next deal without selling this one.
Negotiation context
- It's been on market 50 days — a 3% lower offer ($630k) is reasonable based on typical stale-listing flexibility.
- 2 sale attempts with the ask held roughly flat each time — persistent listings suggest the price (not the market) is what's stuck; bring a comps-based counter.
Risks & watch-outs
- Climate carrying-cost: severe wildfire risk; extreme-heat days projected 7→22/yr by 2055 (HVAC capex compounding) — expect insurance premiums to compound above CPI over the hold.
Questions for the listing agent
- It's been on market 50 days. Have you received any prior offers? Is the seller open to a 8% concession, seller financing, or rate buy-down credit?
- Is there a deadline driving the sale (1031 exchange, divorce, estate, relocation)? That informs how much negotiation room exists.
- What's the average days-on-market for RENTAL listings here right now (not sales)? A rising rental-DOM trend means longer vacancies and softer asking-rent achievability than the comps imply.
- What's the recent tenant-quality profile in this submarket — average credit score on applications, eviction rate, late-payment / NSF rate, and stable-employment percentage? A property-management company in the area should have these aggregated.
- How much new for-sale + rental construction is in the pipeline within 1–3 miles? Heavy new supply typically softens prices + rents 12–24 months out; constrained supply supports both.
Investment metrics
- 1% rule
- 0.92% ✗
- Cap rate
- 6.75%
- Cash-on-cash
- 1.64%
- DSCR
- 1.07
- GRM
- 9.0
CMA / ARV
No comps found within radius.
Projected returns pro-forma
6.3% appreciation · 3.0% rent growth · sell at horizon
- IRR
- 17.4%
- Equity multiple
- 2.18×
- Total profit
- $215,031
- Equity at exit
- $420,825
- IRR
- 17.0%
- Equity multiple
- 4.39×
- Total profit
- $617,469
- Equity at exit
- $773,910
Cash invested: $182,000 (down + closing). Projections, not guarantees.
Landlord ↔ Tenant lean methodology
- Overall (STATE)
- 87 Strongly Landlord-Friendly
- State Texas
- 87 Strongly Landlord-Friendly · R+5
- County
- — inherits STATE
- City
- — inherits STATE
ZIP-level market 79782
- Home prices YoY
- 3.3%
- Active inventory
- 39
- Price-to-rent
- 9.0×
Monthly cashflow live
- Estimated rent
- $6,000 medium interval (Pro) →
- Mortgage (P&I)
- −$3,409
- Tax est. 1.5%
- −$812 /mo · $9,750/yr
- Insurance
- −$271
- HOA
- −$0
- Vacancy / Maint / Mgmt
- −$1,260
- Net cashflow
- $248
Break-even live
UW: 25.0% down · 7.5% · 30yr · 1.5% tax · 5.0% vac · 8.0% maint · 8.0% mgmt
Financing live
Cash to close
- Down payment
- $162,500
- Closing costs
- $19,500
- Reserves months
- —
- Total cash needed
- —
Loan-product check · same deal, 3 products live
Conventional
25% down · 7.5% · 30yr
- Down + closing
- —
- Monthly P&I
- —
- Monthly cashflow
- —
- DSCR
- —
- Eligible?
- —
Personal DTI + credit; lowest rate.
DSCR
20% down · 8.5% · 30yr
- Down + closing
- —
- Monthly P&I
- —
- Monthly cashflow
- —
- DSCR
- —
- Eligible?
- —
No personal income docs; deal must DSCR.
Hard money
10% down · 12.0% · 12mo
- Down + closing
- —
- Monthly P&I
- —
- Monthly cashflow
- —
- DSCR
- —
- Eligible?
- —
Short-term bridge; refi at stabilization.
Rent comps 1 comps
| Address | Beds | Baths | Sqft | Rent | $/sqft | DOM | Units | Dist |
|---|---|---|---|---|---|---|---|---|
| 3701 Timberwolf Trl Midland, TX | 3.0 | 3.0 | 2873 | $6,000 | $2.09 | 44d | 1 | 0.95mi |
Listing history 18 events
-
2026-06-19days on market $650,000 Active 50 DOM
-
2026-06-18days on market $650,000 Active 49 DOM
-
2026-06-17days on market $650,000 Active 48 DOM
-
2026-06-16days on market $650,000 Active 47 DOM
-
2026-06-15days on market $650,000 Active 46 DOM
-
2026-06-14days on market $650,000 Active 44 DOM
-
2026-06-13days on market $650,000 Active 43 DOM
-
2026-06-10days on market $650,000 Active 41 DOM
-
2026-06-09days on market $650,000 Active 40 DOM
-
2026-06-08days on market $650,000 Active 39 DOM
-
2026-06-07days on market $650,000 Active 38 DOM
-
2026-06-02days on market $650,000 Active 33 DOM
-
2026-06-01days on market $650,000 Active 32 DOM
-
2026-05-31days on market $650,000 Active 31 DOM
-
2026-05-30days on market $650,000 Active 30 DOM
-
2026-04-30$650,000 Active 409-char remark
-
2026-04-26$650,000 Active 465-char remark
Show marketing remark (465 chars)
Do not miss on this beautiful 4 bedroom 3 bathroom new construction home featuring high-end finishes throughout, including solid wood cabinetry, granite countertops, and a blend of tile flooring with plush carpet in bedrooms. Spacious open layout with oversized rooms and a primary suite offering dual (his & hers) closets. Situated on a 1-acre lot with a fenced backyard. 2 car garage custom sized 8x18. Enjoy Midland lifestyle with Stanton taxes! Must tour!
-
2026-04-09price $665,000
ⓘ Source: listings_history table (triggers on properties + properties_extension) + one-shot
backfill from property_details.listing_events for pre-trigger history.
Climate risk First Street
- Flood 1/10 Low 0% chance over 30 yrs
- Wildfire 8/10 Severe
- Heat 6/10 Major 7 d/yr ≥102°F today · 22 d/yr by 30 yrs out
- Wind 3/10 Moderate 5% chance of damaging wind over 30 yrs
- Air quality 1/10 Low 0 unhealthy d/yr today · 0 by 30 yrs out
Nearby sold comps map
Loading sold comps map…
Walkable amenities ~0.75 mi
Loading nearby amenities…
Taxation est. · year 1
- Rental income
- $72,000
- − Mortgage interest
- −$36,410
- − Property taxes
- −$9,750
- − Insurance
- −$3,250
- − Repairs & maintenance
- −$5,760
- − Management
- −$5,760
- − Depreciation
- −$18,909
- Taxable loss
- −$7,839
- Est. tax savings @ 24.0%
- +$1,881
- After-tax cash flow
- $4,857/yr
For passive investors: Depreciation is non-cash, so a rental often shows a tax loss while cash-flowing — sheltering income. Rental losses are passive: they offset passive income freely, and up to $25,000/yr can offset ordinary (W-2) income if you actively participate and your MAGI is under $100k (phasing out to $0 by $150k); unused losses carry forward. On sale, claimed depreciation is recaptured at up to 25%, and gains may owe capital-gains tax (a 1031 exchange can defer both). Figures are a year-1 estimate at your 24.0% rate — not tax advice; consult a CPA.
Schools (NCES district)
- District
- Stanton ISD
- NCES district ID
- 4841430
- Math proficiency
- 40% ▼ -1.00%
- Reading proficiency
- 39% ▲ 5.00%
- Median HH income
- $47,595
- Composite
- 33.86/100
- National rank
- #5353
- State rank
- #426 of 826 in TX
Livability — Midland
- Score
- 79/100
- State rank
- #57
- US rank
- #2192
Category grades
Schools grade is shown separately in the Schools card above.
Census & demographics
- City population
- 168,494
- Population (ZIP)
- 3,831
Population outlook (Martin County) Hauer SSP2
- Today (2025)
- 7,556 people
- By 2030
- 8,556 · +13.2%
- By 2040
- 10,786 · +42.7%
- By 2050
- 13,158 · +74.1%
- By 2075
- 19,334 · +155.9%
- By 2100
- 23,704 · +213.7%
Race, ethnicity, and origin ACS 2023
- Neighborhood character
- Majority Hispanic (53%)
- Race & ethnicity
- Hispanic / Latino 53% White 43% Two or more races 8% Black 2%
- Hispanic origin (detail)
- Mexican 51%
- Common ancestry
- Slovak 1% Italian 1% Scotch-Irish 1%
- Foreign-born
- 10% · Canada
- Languages at home
- 65% English-only · Spanish 33% German/W. Germanic 2%
Political lean MEDSL · Martin
- 2024 margin
- Solid R (+75.8) · D 11.9% · R 87.6%
- 2008→2024 swing
- -13.1pp toward R · 2008: -62.7pp · 2024: -75.8pp
- All cycles
- 2024: R+75.8 2020: R+72.6 2016: R+67.6 2012: R+68.5 2008: R+62.7
Not yet ingested
- Civics
- —
Market trends
- HPI YoY
- ▲ 6.30%
- Current HPI
- 195.1131
- Rent YoY
- —
- Metro
- —
- State GDP YoY
- ▲ 3.95%
- F500 in state
- 110
Industry mix (Fortune 500 HQ in TX)
| Industry | F500 HQs | Revenue |
|---|---|---|
| Energy | 16 | $1,198B |
|
||
| Technology | 5 | $198B |
|
||
| Engineering / Construction | 4 | $72B |
|
||
| Energy Services | 3 | $60B |
|
||
| Utilities | 3 | $41B |
|
||
| Healthcare | 2 | $330B |
|
||
Price history
-2.3% since first listed3 events — show timeline
- 2026-04-30 Listed $650,000 ODMLS
- 2026-04-26 Listed $650,000 PBBOR
- 2026-04-09 Price Changed $665,000 PBBOR
Cash-flow waterfall
monthlySold comps — $/sqft
last 12 mo · ≤1 miLoading sold comps…