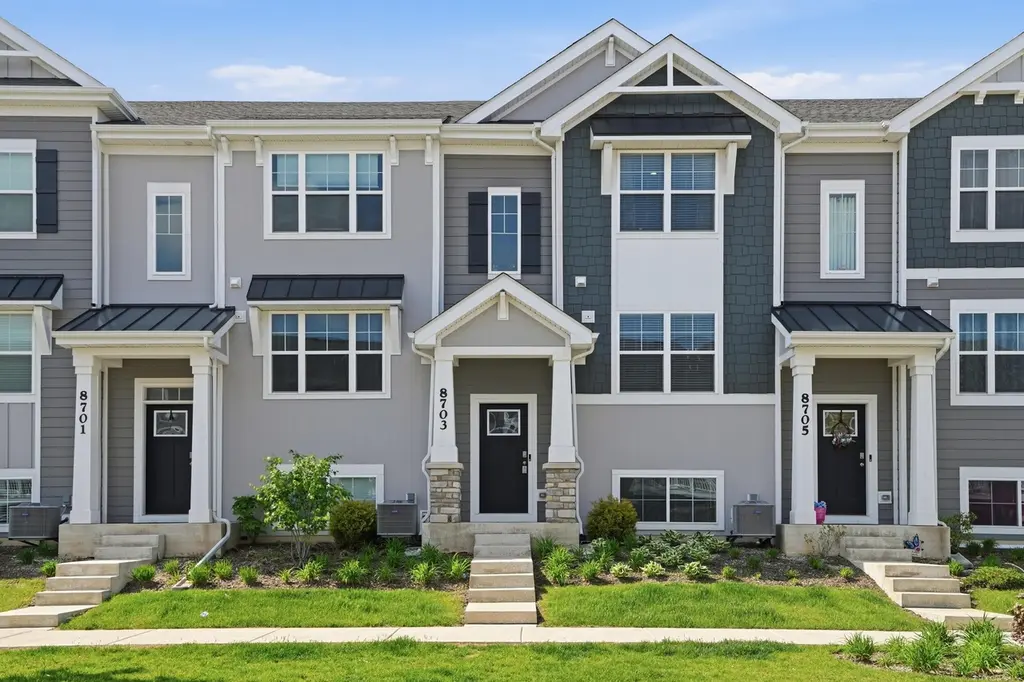
8703 Orchid Dr
St. John, IN 46373
$314,900D+
3 bd · 2.5 ba ·
2,000 sqft ·
Built 2023
· Townhouse
· Active
· 30 DOM
Cashflow @ list (25.0% down · 7.5%)
Estimated rent
$2,837/mo
Mortgage (P&I)
−$1,651
Tax + insurance
−$381
HOA
−$220
Vac / Maint / Mgmt
−$596
Net cashflow
$-11/mo
Annual
$-136/yr
Cap rate
6.25%
Cash-on-cash
-0.15%
DSCR
0.99
1% rule
0.90%
Cash to close
$88,172
Investor read
- This is a 3-bed/2.5-bath townhouse listed at $315k. Condition is rated good.
- At list price, monthly cash flow is $-11 ($-136/yr) — negative.
- To cash-flow at today's rent, offer at most $313k (0.6% below list).
- To meet the 1% rule (rent ≥ 1% of price), the offer needs to be $284k (9.9% below list).
- It's been on market 30 days — a 2% lower offer ($310k) is reasonable based on typical stale-listing flexibility.
- Recommended offer: $284k (9.9% below list) — sets the bar for 1% rule.
- Local home prices are declining (-3.0%/yr); year-one equity from $2k of loan paydown is wiped out by about $9k of value loss. Plan a longer hold.
- Location reads: area grade D — affects rentability + tenant quality, not the cash-flow math above.
- Hanover Community School Corporation (suburban): math 49% / reading 53% proficiency, ranked #38 of 301 in IN (top 13%) — acceptable for families but not a draw, mixed tenant base, ~2y average lease; only 20% free/reduced lunch — higher-income household profile.
- Zoned schools: Lincoln Elementary School (math 57% / reading 57%, grade C+, #172 of 994 statewide, top 18%, 312 students, 14% FRL); Hanover Central Middle School (math 44% / reading 47%, grade D+, #79 of 330 statewide, top 24%, 650 students, 25% FRL); Hanover Central High School (math 47% / reading 72%, grade C+, #49 of 369 statewide, top 16%, 782 students, 22% FRL) — zoned schools at 20% FRL track the district average.
- Market conditions: 262 active listings in the ZIP; 7 comparable units currently listed for rent nearby; rentals leasing fast (median 0d on market — plan ~1-2 weeks tenant-placement turnaround); 43% of comp listings sitting > 30 days — soft ceiling on asking rent; 1,642 units permitted in Lake County in 2024 (14 in 5+ unit buildings).
- Lake County population projected to shrink 7% by 2050 — rents likely to lag national; underwrite the cash flow, not the appreciation.
- Cap rate 6.2% vs local median 3.6% in St. John — top-decile yield for the area; either an underpriced asset or a hidden risk that comps aren't pricing in. Stress-test before assuming the spread holds.
Questions for listing agent
- What do current leases actually rent for vs. the listed asking? Can we see a recent rent roll and the last 12 months of T-12 income?
- What does the HOA fee cover, when was the last increase, and are there any pending special assessments or reserve-fund shortfalls?
- Is there a deadline driving the sale (1031 exchange, divorce, estate, relocation)? That informs how much negotiation room exists.
- The area grade is low — what's the realistic commute time and amenity access for the typical tenant pool here? Any planned neighborhood developments (good or bad) we should know about?
- What's the average days-on-market for RENTAL listings here right now (not sales)? A rising rental-DOM trend means longer vacancies and softer asking-rent achievability than the comps imply.
- What's the recent tenant-quality profile in this submarket — average credit score on applications, eviction rate, late-payment / NSF rate, and stable-employment percentage? A property-management company in the area should have these aggregated.
- How much new for-sale + rental construction is in the pipeline within 1–3 miles? Heavy new supply typically softens prices + rents 12–24 months out; constrained supply supports both.
CashFlowRE · CFR-KD84A70V0GR4WE
· Data 1 day ago
cashflowre.app · 2026-05-29