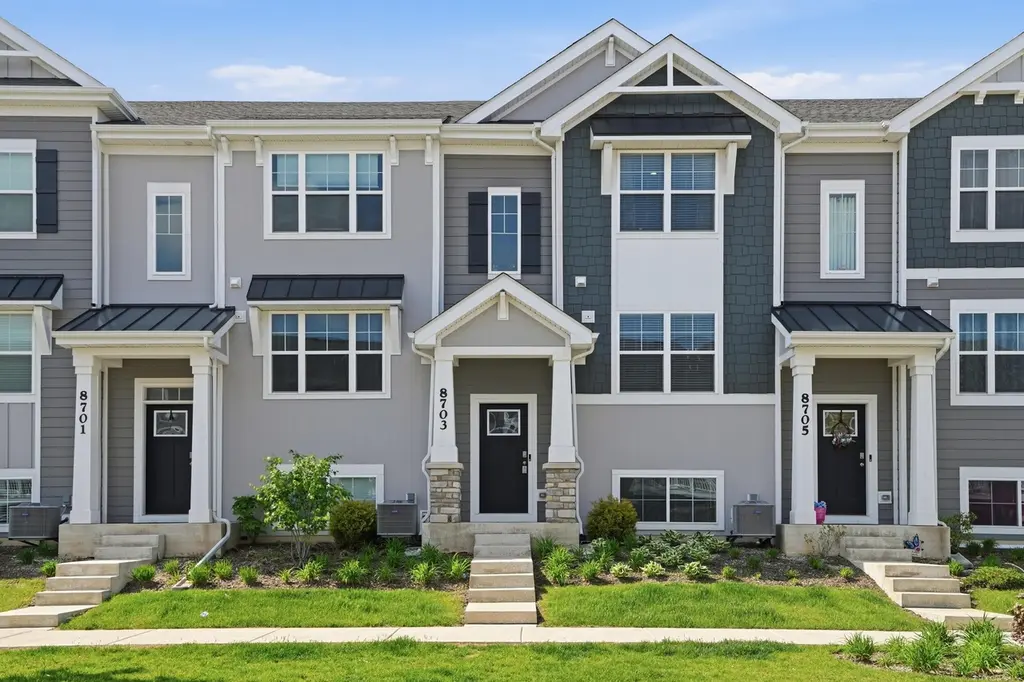
8703 Orchid Dr · St. John, IN
Flood risk 1/10 · Minimal
- FEMA flood zone
- X (unshaded)
- Chance of flooding over 30 yrs
- 0.0%
- Est. flood insurance / yr
- $507 – $1,088
Fire risk 1/10 · Minimal
- Est. fire insurance / yr
- $717 – $1,331
Heat risk 3/10 · Minor
- Hot days now (above 101°F)
- 7 days/yr
- Hot days in 30 yrs
- 16 days/yr
Wind risk 2/10 · Minimal
- Chance of severe wind over 30 yrs
- 1.0%
Air-quality risk 2/10 · Minimal
- Unhealthy air days now
- 1 days/yr
- Unhealthy air days in 30 yrs
- 1 days/yr
Risk factors via First Street. Map © Google.
Why this score? — see what drove the D+ grade
The composite is a weighted blend of 9 inputs, each scored 0–100. Each bar is that input's sub-score; the figure is the points it added to the 100-point composite (weight × sub-score).
- ARV discount +13.4/15.0
- Cash flow +13.1/30.0
- Schools +4.5/10.0
- 1% rule +4.0/10.0
- Condition / age +4.0/5.0
- DSCR +3.9/10.0
- Rent growth +2.5/5.0
- Livability +2.5/5.0
- Appreciation +0.0/10.0
$314,900
🖨 Deal sheet (PDF) 📄 Offer letter ✓ Due diligence
Listing remarks
Better than new! This move-in ready townhome in the clean finished Gates community already includes upgrades and finishes buyers typically add after closing. Built in 2023 and meticulously maintained, this 3-bedroom, 2.5 bath offers over 1700 square feet of living space across three levels. The open-concept main floor showcases a spacious kitchen with quartz countertops, generous cabinet and prep space, newer appliances, and a large center island perfect for entertaining or everyday living. The bright living room opens to a south-facing balcony, perfect for relaxing or entertaining. Upstairs, you'll find three bedrooms, two full baths, and convenient second-floor laundry. The finished lower
Key facts
- $220 HOA
- 2 garage spots
- Built 2023
Property features AI
Finance
- Other: Occupant type: owner
- HOA & community: Homeowners association with monthly fee of $220; HOA covers grounds maintenance and snow removal
Exterior
- Parking: 2-car garage; Garage door opener; Garage faces rear
- Utilities: Public water; Public sewer
- Home design: Attached property; Built in 2023; Three or more levels
- Exterior features: Balcony; Neighborhood view
Interior
- Kitchen: Dishwasher; Refrigerator; Microwave; Electric range
- Bedrooms: Primary bedroom; Bedroom 2; Bedroom 3
- Bathrooms: 1 full bathroom; 1 three-quarter bathroom; 1 half bathroom
- Heating & cooling: Forced air heating (natural gas); Central air conditioning; Ceiling fans
- Interior features: Ceiling fans; Walk-in closets; Stone countertops; Recessed lighting; Pantry; Kitchen island; Double vanity
Neighborhood map
What this means for you Summary
Snapshot
- This is a 3-bed/2.5-bath townhouse listed at $315k. Condition is rated good.
Deal economics
- At list price, monthly cash flow is $-11 ($-136/yr) — negative.
- To cash-flow at today's rent, offer at most $313k (0.6% below list).
- To meet the 1% rule (rent ≥ 1% of price), the offer needs to be $284k (9.9% below list).
- Recommended offer: $284k (9.9% below list) — sets the bar for 1% rule.
- Cap rate 6.2% vs local median 3.6% in St. John — top-decile yield for the area; either an underpriced asset or a hidden risk that comps aren't pricing in. Stress-test before assuming the spread holds.
Location & tenants
- Location reads: area grade D — affects rentability + tenant quality, not the cash-flow math above.
- Hanover Community School Corporation (suburban): math 49% / reading 53% proficiency, ranked #38 of 301 in IN (top 13%) — acceptable for families but not a draw, mixed tenant base, ~2y average lease; only 20% free/reduced lunch — higher-income household profile.
- Zoned schools: Lincoln Elementary School (math 57% / reading 57%, grade C+, #172 of 994 statewide, top 18%, 312 students, 14% FRL); Hanover Central Middle School (math 44% / reading 47%, grade D+, #79 of 330 statewide, top 24%, 650 students, 25% FRL); Hanover Central High School (math 47% / reading 72%, grade C+, #49 of 369 statewide, top 16%, 782 students, 22% FRL) — zoned schools at 20% FRL track the district average.
- Market conditions: 262 active listings in the ZIP; 7 comparable units currently listed for rent nearby; rentals leasing fast (median 0d on market — plan ~1-2 weeks tenant-placement turnaround); 43% of comp listings sitting > 30 days — soft ceiling on asking rent; 1,642 units permitted in Lake County in 2024 (14 in 5+ unit buildings).
Forward outlook
- Local home prices are declining (-3.0%/yr); year-one equity from $2k of loan paydown is wiped out by about $9k of value loss. Plan a longer hold.
- Lake County population projected to shrink 7% by 2050 — rents likely to lag national; underwrite the cash flow, not the appreciation.
Negotiation context
- It's been on market 30 days — a 2% lower offer ($310k) is reasonable based on typical stale-listing flexibility.
Questions for the listing agent
- What do current leases actually rent for vs. the listed asking? Can we see a recent rent roll and the last 12 months of T-12 income?
- What does the HOA fee cover, when was the last increase, and are there any pending special assessments or reserve-fund shortfalls?
- Is there a deadline driving the sale (1031 exchange, divorce, estate, relocation)? That informs how much negotiation room exists.
- The area grade is low — what's the realistic commute time and amenity access for the typical tenant pool here? Any planned neighborhood developments (good or bad) we should know about?
- What's the average days-on-market for RENTAL listings here right now (not sales)? A rising rental-DOM trend means longer vacancies and softer asking-rent achievability than the comps imply.
- What's the recent tenant-quality profile in this submarket — average credit score on applications, eviction rate, late-payment / NSF rate, and stable-employment percentage? A property-management company in the area should have these aggregated.
- How much new for-sale + rental construction is in the pipeline within 1–3 miles? Heavy new supply typically softens prices + rents 12–24 months out; constrained supply supports both.
Investment metrics
- 1% rule
- 0.90% ✗
- Cap rate
- 6.25%
- Cash-on-cash
- -0.15%
- DSCR
- 0.99
- GRM
- 9.2
CMA / ARV
- ARV (on-the-fly)
- $362,000
- Comps found
- 12
Show comp detail 12 sales within ~0.75 mi
| Address | Dist | Beds/Ba | Sqft | Sold | Price | $/sf | Match |
|---|---|---|---|---|---|---|---|
| 8737 Clover Ln | 0.05mi | 3/2.5 | 1,756 (-12%) | 1mo | $309,000 | $176 | 77 |
| 8690 Larkspur Ln | 0.04mi | 3/2.5 | 1,751 (-12%) | 4mo | $307,000 | $175 | 74 |
| 8700 Larkspur Ln | 0.03mi | 3/2.5 | 1,758 (-12%) | 7mo | $315,000 | $179 | 73 |
| FAIRFAX Park PL | 0.52mi | 3/2.5 | 1,970 (-2%) | 2mo | $278,000 | $141 | 71 |
| 8746 Clover Ln | 0.07mi | 3/2.0 | 1,756 (-12%) | 5mo | $322,340 | $184 | 70 |
| 8741 W 108th Dr | 0.10mi | 3/2.5 | 1,756 (-12%) | 8mo | $320,000 | $182 | 68 |
| 10721 Maple Ln | 0.40mi | 3/2.0 | 2,107 (+5%) | 4mo | $350,000 | $166 | 67 |
| 9346 Green Meadow Dr | 0.50mi | 3/2.0 | 1,880 (-6%) | 1mo | $380,000 | $202 | 64 |
| 9448 W 106th Pl | 0.46mi | 3/2.0 | 1,838 (-8%) | 7mo | $449,900 | $245 | 58 |
| 10680 Arbor Ln | 0.51mi | 3/2.0 | 1,792 (-10%) | 1mo | $425,000 | $237 | 56 |
| 9298 W 107th Pl | 0.33mi | 3/2.5 | 2,279 (+14%) | 6mo | $379,900 | $167 | 56 |
| 9567 Mill Creek Rd | 0.63mi | 2/3.0 (-1) | 1,900 (-5%) | 7mo | $344,500 | $181 | 50 |
Match score weights: distance 35% · size 25% · config 20% · recency 20%. Top-matched comps best support the ARV.
Projected returns pro-forma
-3.0% appreciation · 3.0% rent growth · sell at horizon
- IRR
- -16.5%
- Equity multiple
- 0.41×
- Total profit
- $-51,661
- Equity at exit
- $46,953
- IRR
- -8.2%
- Equity multiple
- 0.48×
- Total profit
- $-45,552
- Equity at exit
- $27,227
Cash invested: $88,172 (down + closing). Projections, not guarantees.
Landlord ↔ Tenant lean methodology
- Overall (STATE)
- 90 Strongly Landlord-Friendly
- State Indiana
- 90 Strongly Landlord-Friendly · R+11
- County
- — inherits STATE
- City
- — inherits STATE
ZIP-level market 46373
- Home prices YoY
- -23.8%
- Active inventory
- 262
- Price-to-rent
- 9.2×
Monthly cashflow live
- Estimated rent
- $2,837 high interval (Pro) →
- Mortgage (P&I)
- −$1,651
- Tax from tax record
- −$250 /mo · $3,002/yr
- Insurance
- −$131
- HOA
- −$220
- Vacancy / Maint / Mgmt
- −$596
- Net cashflow
- $-11
Break-even live
Sensitivity live
| Price | -10% $167 | -5% $78 | +0% $-11 | +5% $-100 | +10% $-190 |
|---|---|---|---|---|---|
| Rent | -10% $-235 | -5% $-123 | +0% $-11 | +5% $101 | +10% $213 |
| Rate | -1.0pp $147 | -0.5pp $69 | base $-11 | +0.5pp $-93 | +1.0pp $-176 |
UW: 25.0% down · 7.5% · 30yr · 1.5% tax · 5.0% vac · 8.0% maint · 8.0% mgmt
Financing live
Cash to close
- Down payment
- $78,725
- Closing costs
- $9,447
- Reserves months
- —
- Total cash needed
- —
Loan-product check · same deal, 3 products live
Conventional
25% down · 7.5% · 30yr
- Down + closing
- —
- Monthly P&I
- —
- Monthly cashflow
- —
- DSCR
- —
- Eligible?
- —
Personal DTI + credit; lowest rate.
DSCR
20% down · 8.5% · 30yr
- Down + closing
- —
- Monthly P&I
- —
- Monthly cashflow
- —
- DSCR
- —
- Eligible?
- —
No personal income docs; deal must DSCR.
Hard money
10% down · 12.0% · 12mo
- Down + closing
- —
- Monthly P&I
- —
- Monthly cashflow
- —
- DSCR
- —
- Eligible?
- —
Short-term bridge; refi at stabilization.
Rent comps 7 comps
| Address | Beds | Baths | Sqft | Rent | $/sqft | DOM | Units | Dist |
|---|---|---|---|---|---|---|---|---|
| 8688 Larkspur Ln Saint John, IN | 3.0 | 2.5 | 1758 | $3,000 | $1.71 | 0d | 1 | 0.02mi |
| 8726 Orchid Dr Saint John, IN | 3.0 | 2.5 | 1756 | $2,725 | $1.55 | 45d | 1 | 0.03mi |
| 8754 Clover Ln Saint John, IN | 3.0 | 2.5 | 1756 | $2,675 | $1.52 | 45d | 1 | 0.07mi |
| 8769 W 108th Ln Saint John, IN | 3.0 | 2.5 | 1758 | $2,775 | $1.58 | 45d | 1 | 0.10mi |
| 10342 Adler Cv Saint John, IN | 3.0 | 2.0 | 1944 | $3,000 | $1.54 | 0d | 1 | 0.47mi |
| 7828 W 105th Pl Crown Point, IN | 4.0 | 2.5 | 2521 | $3,200 | $1.27 | 0d | 1 | 0.61mi |
| 7750 W 105th Pl Crown Point, IN | 3.0 | 2.5 | 2251 | $3,350 | $1.49 | 0d | 1 | 0.65mi |
HOA detail
- Monthly dues
- $220 · $2,640/yr
Listing history 16 events
-
2026-06-21remarks 699-char remark
-
2026-06-21days on market $314,900 Active 30 DOM
-
2026-06-18days on market $314,900 Active 27 DOM
-
2026-06-17days on market $314,900 Active 26 DOM
-
2026-06-16days on market $314,900 Active 25 DOM
-
2026-06-15days on market $314,900 Active 24 DOM
-
2026-06-13pricedays on market $314,900 Active 22 DOM
-
2026-06-09days on market $315,900 Active 18 DOM
-
2026-06-08days on market $315,900 Active 17 DOM
-
2026-06-07days on market $315,900 Active 16 DOM
-
2026-06-04days on market $315,900 Active 13 DOM
-
2026-06-03days on market $315,900 Active 12 DOM
-
2026-06-02days on market $315,900 Active 11 DOM
-
2026-06-01days on market $315,900 Active 10 DOM
-
2026-05-31days on market $315,900 Active 9 DOM
-
2026-05-22$315,900 Active
ⓘ Source: listings_history table (triggers on properties + properties_extension) + one-shot
backfill from property_details.listing_events for pre-trigger history.
Tax reassessment forecast IN · Partial reset (capped growth)
- Current annual tax
- $3,002 · $250/mo
- Projected year-2 tax
- $3,002 · $250/mo
- Expected delta
- $0/yr ($0/mo · 0.0%)
ⓘ Screening estimate from a state-policy table — verify with the county assessor before closing.
Climate risk First Street
- Flood 1/10 Low FEMA zone X (unshaded) · 0% chance over 30 yrs
- Wildfire 1/10 Low
- Heat 3/10 Moderate 7 d/yr ≥101°F today · 16 d/yr by 30 yrs out
- Wind 2/10 Low 100% chance of damaging wind over 30 yrs
- Air quality 2/10 Low 1 unhealthy d/yr today · 1 by 30 yrs out
Nearby sold comps map
Loading sold comps map…
Walkable amenities ~0.75 mi
Loading nearby amenities…
Taxation est. · year 1
- Rental income
- $34,046
- − Mortgage interest
- −$17,639
- − Property taxes
- −$3,002
- − Insurance
- −$1,574
- − Repairs & maintenance
- −$2,724
- − Management
- −$2,724
- − HOA
- −$2,640
- − Depreciation
- −$9,161
- Taxable loss
- −$5,418
- Est. tax savings @ 24.0%
- +$1,300
- After-tax cash flow
- $1,164/yr
For passive investors: Depreciation is non-cash, so a rental often shows a tax loss while cash-flowing — sheltering income. Rental losses are passive: they offset passive income freely, and up to $25,000/yr can offset ordinary (W-2) income if you actively participate and your MAGI is under $100k (phasing out to $0 by $150k); unused losses carry forward. On sale, claimed depreciation is recaptured at up to 25%, and gains may owe capital-gains tax (a 1031 exchange can defer both). Figures are a year-1 estimate at your 24.0% rate — not tax advice; consult a CPA.
Condition & rehab AI · 12 photos
This townhouse is in good condition with a fresh exterior and interior. It is move-in ready with minor maintenance items to address.
Value-add opportunities
- Resale Paint exterior trim — Fresh paint can enhance curb appeal and property value.
- Rental Clean gutters — Clean gutters improve property maintenance and reduce maintenance costs for tenants.
Renovation cost estimate screening
Value-add ROI direction
- Resale Paint exterior trim — Fresh paint can enhance curb appeal and property value. ↑
- Rental Clean gutters — Clean gutters improve property maintenance and reduce maintenance costs for tenants. ↑
ⓘ Cost ranges are severity-bucket heuristics (US national rule-of-thumb). Get contractor quotes + a written scope before underwriting a rehab budget.
Schools (NCES district)
- District
- Hanover Community School Corporation
- NCES district ID
- 1804350
- Math proficiency
- 49% ▼ -11.00%
- Reading proficiency
- 53% ▼ -7.00%
- Median HH income
- $68,151
- Composite
- 45.34/100
- National rank
- #2637
- State rank
- #38 of 301 in IN
Livability — St. John
No livability data for this city. (Only ~50 U.S. cities are tracked.)
Census & demographics
- Census place
- St. John, IN
- City population
- 18,509
- Population (ZIP)
- 18,509
Population outlook (Lake County) Hauer SSP2
- Today (2025)
- 484,026 people
- By 2030
- 478,091 · -1.2%
- By 2040
- 462,974 · -4.3%
- By 2050
- 449,894 · -7.1%
- By 2075
- 436,169 · -9.9%
- By 2100
- 426,607 · -11.9%
Race, ethnicity, and origin ACS 2023
- Neighborhood character
- Predominantly White (82%)
- Race & ethnicity
- White 82% Hispanic / Latino 9% Two or more races 5% Black 3% Asian 2%
- Hispanic origin (detail)
- Mexican 7% Puerto Rican 1%
- Common ancestry
- Romanian 21% Iranian 6% Lithuanian 2%
- Foreign-born
- 6% · Canada
- Languages at home
- 89% English-only · Spanish 5% Russian/Polish/Slavic 4% Other Indo-European 1%
Political lean MEDSL · Lake
- 2024 margin
- Lean D (+5.6) · D 52.1% · R 46.5% · Other 1.5%
- 2008→2024 swing
- -28.6pp toward R · 2008: 34.3pp · 2024: 5.6pp
- All cycles
- 2024: D+5.6 2020: D+15.1 2016: D+20.6 2012: D+31.0 2008: D+34.3
Not yet ingested
- Civics
- —
Market trends
- HPI YoY
- ▼ -69.86%
- Current HPI
- 224.1176
- Rent YoY
- —
- Metro
- —
- State GDP YoY
- ▲ 2.90%
- F500 in state
- 18
Industry mix (Fortune 500 HQ in IN)
| Industry | F500 HQs | Revenue |
|---|---|---|
| Industrial Machinery | 2 | $37B |
|
||
| Healthcare | 1 | $177B |
|
||
| Pharmaceuticals | 1 | $45B |
|
||
| Metals / Steel | 1 | $18B |
|
||
| Agriculture | 1 | $17B |
|
||
| Packaging | 1 | $12B |
|
||
Price history
1 event — show timeline
- 2026-05-22 Listed $315,900 NIRA MLS as Distributed by MLS Grid
Property tax history
+917.8%/yrLatest (2024): $3,002 · +917.8% YoY. Source: county tax records.
Cash-flow waterfall
monthlySold comps — $/sqft
last 12 mo · ≤1 miLoading sold comps…