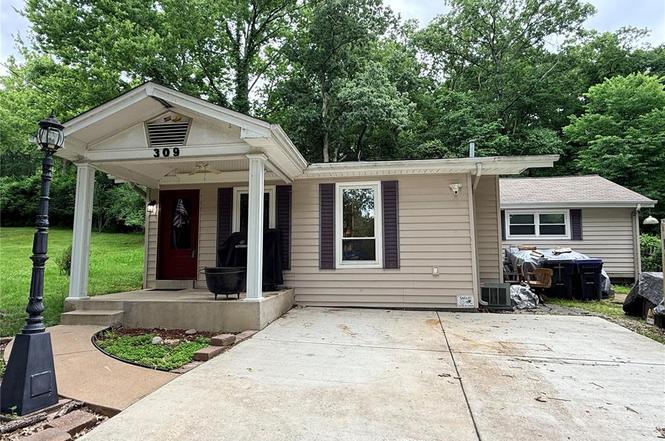
309 Jefferson Ave
Wildwood, MO 63038
$120,000B
2 bd · 1.0 ba ·
1,402 sqft ·
Built 1948
· SingleFamily
· Coming Soon
· 1 DOM
Cashflow @ list (25.0% down · 7.5%)
Estimated rent
$1,685/mo
Mortgage (P&I)
−$629
Tax + insurance
−$172
HOA
−$0
Vac / Maint / Mgmt
−$354
Net cashflow
$530/mo
Annual
$6,360/yr
Cap rate
11.59%
Cash-on-cash
18.93%
DSCR
1.84
1% rule
1.40%
Cash to close
$33,600
Investor read
- This is a 2-bed/1.0-bath single-family listed at $120k.
- At list price, monthly cash flow is $530 ($6k/yr) — positive.
- The deal already cash-flows at list — no discount required.
- Meets the 1% rule at list price ($2k rent vs $120k).
- Only 1 days on market — expect competitive offers; lowballing is unlikely to land.
- Local home prices are declining (-3.0%/yr); year-one equity from $830 of loan paydown is wiped out by about $4k of value loss. Plan a longer hold.
- Location reads 64/100 on livability (#300 in MO) — a middle-class / working-renter tenant base. Strengths: employment A+, housing A+, crime A-; Watch: amenities F, commute F, cost of living F.
- Rockwood R-VI (suburban): math 51% / reading 64% proficiency, ranked #9 of 324 in MO (top 3%) — acceptable for families but not a draw, mixed tenant base, ~2y average lease; only 10% free/reduced lunch — higher-income household profile.
- Zoned schools: Blevins Elem. (math 36% / reading 56%, grade D-, #402 of 1,115 statewide, top 36%, 431 students, 11% FRL); Eureka Sr. High (math 36% / reading 66%, grade D+, #109 of 521 statewide, top 21%, 1,712 students, 10% FRL) — zoned schools at 10% FRL track the district average.
- Watch-outs: built in 1948 — expect roof / HVAC / electrical / plumbing capex.
- Market conditions: 56 active listings in the ZIP; 920 units permitted in St. Louis County in 2024 (250 in 5+ unit buildings).
- Current owner paid $24k; list at $120k implies a 392% gain — meaningful room to come down on a strong offer.
- At projected returns (-3.0% appreciation + 3.0% rent growth), your $34k cash investment doubles in ~7 years — after that, you're playing with house money.
- Climate carrying-cost: extreme-heat days projected 7→20/yr by 2055 (HVAC capex compounding) — expect insurance premiums to compound above CPI over the hold.
- Cap rate 11.6% vs local median 1.7% in Wildwood — top-decile yield for the area; either an underpriced asset or a hidden risk that comps aren't pricing in. Stress-test before assuming the spread holds.
Questions for listing agent
- Built in 1948 — when were the roof, HVAC, electrical panel, plumbing, and water heater last replaced?
- Is there a deadline driving the sale (1031 exchange, divorce, estate, relocation)? That informs how much negotiation room exists.
- Schools are A-rated — typically a magnet for longer-tenancy family renters. What's the average tenant stay here, and is there a school-zone premium baked into asking?
- What's the average days-on-market for RENTAL listings here right now (not sales)? A rising rental-DOM trend means longer vacancies and softer asking-rent achievability than the comps imply.
- What's the recent tenant-quality profile in this submarket — average credit score on applications, eviction rate, late-payment / NSF rate, and stable-employment percentage? A property-management company in the area should have these aggregated.
- How much new for-sale + rental construction is in the pipeline within 1–3 miles? Heavy new supply typically softens prices + rents 12–24 months out; constrained supply supports both.
CashFlowRE · CFR-KE7PSRAC7976HG
· Data 3 days ago
cashflowre.app · 2026-05-29