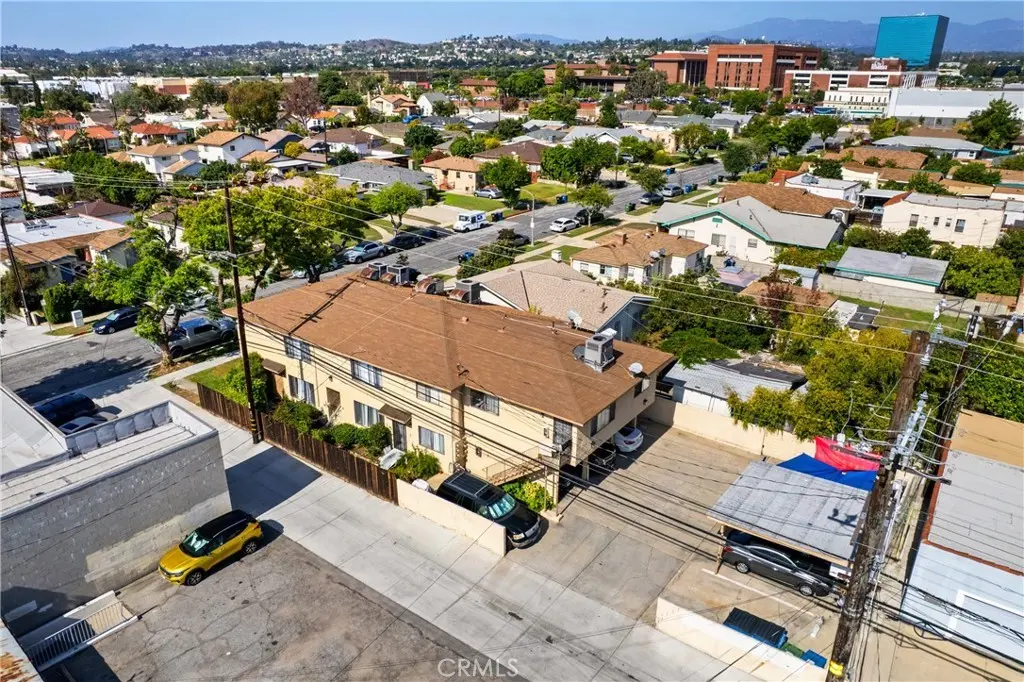
1342 Edgewood
Alhambra, CA 91803
$1,799,000D
9 bd · 9.0 ba ·
4,422 sqft ·
Built 1979
· MultiFamily
· Active
· 240 DOM
Cashflow @ list (25.0% down · 7.5%)
Estimated rent
$17,394/mo
Mortgage (P&I)
−$9,434
Tax + insurance
−$2,542
HOA
−$0
Vac / Maint / Mgmt
−$3,653
Net cashflow
$1,765/mo
Annual
$21,176/yr
Cap rate
7.47%
Cash-on-cash
4.20%
DSCR
1.19
1% rule
0.97%
Cash to close
$503,720
Investor read
- This is a 5 × 9-bed/9.0-bath units multifamily listed at $1.80M.
- At list price, monthly cash flow is $2k ($21k/yr) — positive. Per door: $353/mo.
- The deal already cash-flows at list — no discount required.
- To meet the 1% rule (rent ≥ 1% of price), the offer needs to be $1.74M (3.3% below list).
- It's been on market 240 days — a 12% lower offer ($1.58M) is reasonable based on typical stale-listing flexibility.
- Recommended offer: $1.58M (12.0% below list) — sets the bar for market timing.
- Local home prices are declining (-3.0%/yr); year-one equity from $12k of loan paydown is wiped out by about $54k of value loss. Plan a longer hold.
- Location reads: area grade D — affects rentability + tenant quality, not the cash-flow math above.
- Alhambra Unified (suburban): math 56% / reading 64% proficiency, ranked #262 of 1,400 in CA (top 19%) — acceptable for families but not a draw, mixed tenant base, ~2y average lease.
- Zoned schools: Fremont Elementary (617 students, 45% FRL); Alhambra High (2,160 students, 57% FRL) — zoned schools at 51% FRL track the district average.
- Market conditions: Rents soft (-1.0%/yr); 38 active listings in the ZIP; solid renter incomes; 19,697 units permitted in Los Angeles County in 2024 (9,426 in 5+ unit buildings).
- Los Angeles County population projected at +9% by 2050 — modest demand growth; plan on rents tracking national, not racing it.
- Climate carrying-cost: extreme-heat days projected 7→21/yr by 2055 (HVAC capex compounding) — expect insurance premiums to compound above CPI over the hold.
- Cap rate 7.5% vs local median 1.8% in Alhambra — top-decile yield for the area; either an underpriced asset or a hidden risk that comps aren't pricing in. Stress-test before assuming the spread holds.
- At $17,394/mo this rent would consume 248% of the median local household income ($84k/yr) (locally 1540% of renters already pay >50% of income on rent) — very limited rent-growth headroom before tenants either downsize or default.
Questions for listing agent
- It's been on market 240 days. Have you received any prior offers? Is the seller open to a 12% concession, seller financing, or rate buy-down credit?
- Can we see the unit-by-unit rent roll, current vacancy, and any below-market leases? What's the average tenancy length?
- What capital expenditures (roof, boiler, parking lot, exteriors) have been made in the last 5 years, and what's planned in the next 2?
- Built in 1979 — when were the roof, HVAC, electrical panel, plumbing, and water heater last replaced?
- Why hasn't it sold? Are there any deal-killer items the seller is aware of (foundation, flood, title, zoning, code violations)?
- Is there a deadline driving the sale (1031 exchange, divorce, estate, relocation)? That informs how much negotiation room exists.
- The area grade is low — what's the realistic commute time and amenity access for the typical tenant pool here? Any planned neighborhood developments (good or bad) we should know about?
- What's the average days-on-market for RENTAL listings here right now (not sales)? A rising rental-DOM trend means longer vacancies and softer asking-rent achievability than the comps imply.
CashFlowRE · CFR-KFZNCXCAX93E36
· Data 1 h ago
cashflowre.app · 2026-05-29