 5-Plex
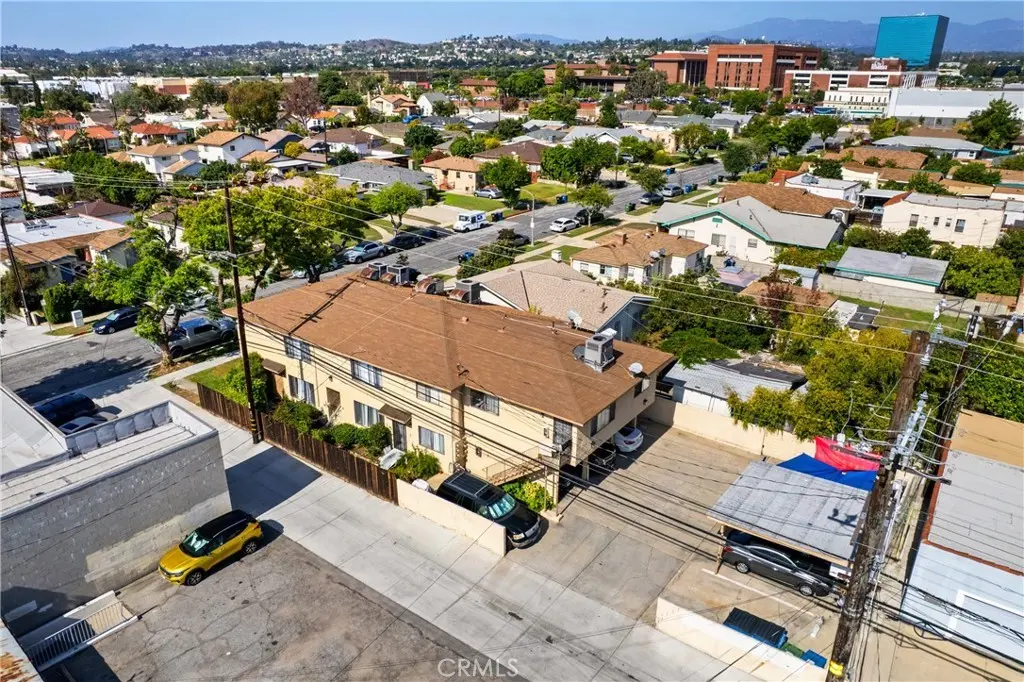
1342 Edgewood · Alhambra, CA
Flood risk 1/10 · Minimal
- FEMA flood zone
- X (unshaded)
- Chance of flooding over 30 yrs
- 0.0%
- Est. flood insurance / yr
- $507 – $1,088
Fire risk 1/10 · Minimal
- Est. fire insurance / yr
- $659 – $1,223
Heat risk 6/10 · Moderate
- Hot days now (above 97°F)
- 7 days/yr
- Hot days in 30 yrs
- 21 days/yr
Wind risk 1/10 · Minimal
- Chance of severe wind over 30 yrs
- —
Air-quality risk 6/10 · Moderate
- Unhealthy air days now
- 10 days/yr
- Unhealthy air days in 30 yrs
- 10 days/yr
Risk factors via First Street. Map © Google.
Why this score? — see what drove the D grade
The composite is a weighted blend of 9 inputs, each scored 0–100. Each bar is that input's sub-score; the figure is the points it added to the 100-point composite (weight × sub-score).
- Cash flow +18.7/30.0
- DSCR +5.9/10.0
- Schools +5.3/10.0
- 1% rule +4.7/10.0
- Livability +2.5/5.0
- Condition / age +2.5/5.0
- Rent growth +2.3/5.0
- ARV discount +0.0/15.0
- Appreciation +0.0/10.0
$1,799,000
🖨 Deal sheet (PDF) 📄 Offer letter ✓ Due diligence
Multi-family units
County records classify this as Multi-Family (5+ Unit). Listing-text estimate: 5 units. confirmed
5+ unit building — per-unit beds/baths from public records are typically unavailable; the breakdown below (if shown) is an estimate from the listing text.
Listing remarks MLS
OUTSTANDING POTENTIAL!!!! Large lot of 6,615! With bus connectivity and access to nearby Metro and Metrolink lines, Edgewood sits within the type of transit-connected location increasingly sought after by multifamily and redevelopment investors. This is the property you've been waiiting for! Prime 5-Unit Investment Opportunity to add extra value to any investment portfolio! An exceptional opportunity for the savvy investor — this 5-unit income property is ideally located north of the 10 freeway in one of Alhambra’s most desirable and stable rental markets. All units are occupied with month to month tenants. Positioned in a high-demand neighborhood, the complex is conveniently close to Cal State LA, local schools, shopping, dining, and major employment hubs in Downtown Alhambra, Pasadena, and Downtown Los Angeles. Proforma reflects current market value at the time of the listing. All tenants have assigned parking, water and trash are included in the rent. This is a FANTASTIC opportunity and a great start for the new investor looking at multi-unit opportunities. Positioned in a fabulous neighborhood and set on a 6,615 sq. ft. lot, this property offers 4,422 sq. ft. of total living space with 9 bedrooms and 9 bathrooms across five units. There are four * 2 bed/2 bath units * and one * 1 bed/1 bath * . All are spaciously appointed with large living rooms and each unit enjoys on-site assigned parking, a very valuable amenity for tenants in this area. Potential for additional units must be verified with the city. The property also features an * * on-site laundry room * * with owner-operated machines, providing additional income potential and tenant convenience. With consistent rental demand, a prime commuter location, and solid fundamentals, this Alhambra property presents a rare opportunity to acquire a turnkey asset with long-term upside. Looking for a stable, income-producing property in a proven Los Angeles County market? This one checks all the boxes.
Key facts
- On site laundry room
- 6,615 sq ft lot
- 9 parking spots
Tags
Neighborhood map
What this means for you Summary
Snapshot
- This is a 5 × 9-bed/9.0-bath units multifamily listed at $1.80M.
Deal economics
- At list price, monthly cash flow is $2k ($21k/yr) — positive. Per door: $353/mo.
- The deal already cash-flows at list — no discount required.
- To meet the 1% rule (rent ≥ 1% of price), the offer needs to be $1.74M (3.3% below list).
- Recommended offer: $1.58M (12.0% below list) — sets the bar for market timing.
- Cap rate 7.5% vs local median 1.8% in Alhambra — top-decile yield for the area; either an underpriced asset or a hidden risk that comps aren't pricing in. Stress-test before assuming the spread holds.
Location & tenants
- Location reads: area grade D — affects rentability + tenant quality, not the cash-flow math above.
- Alhambra Unified (suburban): math 56% / reading 64% proficiency, ranked #262 of 1,400 in CA (top 19%) — acceptable for families but not a draw, mixed tenant base, ~2y average lease.
- Zoned schools: Fremont Elementary (617 students, 45% FRL); Alhambra High (2,160 students, 57% FRL) — zoned schools at 51% FRL track the district average.
- Market conditions: Rents soft (-1.0%/yr); 39 active listings in the ZIP; solid renter incomes; 19,697 units permitted in Los Angeles County in 2024 (9,426 in 5+ unit buildings).
- At $17,394/mo this rent would consume 248% of the median local household income ($84k/yr) (locally 1540% of renters already pay >50% of income on rent) — very limited rent-growth headroom before tenants either downsize or default.
Forward outlook
- Local home prices are declining (-3.0%/yr); year-one equity from $12k of loan paydown is wiped out by about $54k of value loss. Plan a longer hold.
- Los Angeles County population projected at +9% by 2050 — modest demand growth; plan on rents tracking national, not racing it.
Negotiation context
- It's been on market 239 days — a 12% lower offer ($1.58M) is reasonable based on typical stale-listing flexibility.
Risks & watch-outs
- Climate carrying-cost: extreme-heat days projected 7→21/yr by 2055 (HVAC capex compounding) — expect insurance premiums to compound above CPI over the hold.
Questions for the listing agent
- It's been on market 239 days. Have you received any prior offers? Is the seller open to a 12% concession, seller financing, or rate buy-down credit?
- Can we see the unit-by-unit rent roll, current vacancy, and any below-market leases? What's the average tenancy length?
- What capital expenditures (roof, boiler, parking lot, exteriors) have been made in the last 5 years, and what's planned in the next 2?
- Built in 1979 — when were the roof, HVAC, electrical panel, plumbing, and water heater last replaced?
- Why hasn't it sold? Are there any deal-killer items the seller is aware of (foundation, flood, title, zoning, code violations)?
- Is there a deadline driving the sale (1031 exchange, divorce, estate, relocation)? That informs how much negotiation room exists.
- The area grade is low — what's the realistic commute time and amenity access for the typical tenant pool here? Any planned neighborhood developments (good or bad) we should know about?
- What's the average days-on-market for RENTAL listings here right now (not sales)? A rising rental-DOM trend means longer vacancies and softer asking-rent achievability than the comps imply.
- What's the recent tenant-quality profile in this submarket — average credit score on applications, eviction rate, late-payment / NSF rate, and stable-employment percentage? A property-management company in the area should have these aggregated.
- How much new apartment / multifamily construction is in the pipeline within 1–3 miles? Heavy new supply (>2% of stock underway) typically softens rents 12–24 months out; light construction supports rent growth.
Investment metrics
- 1% rule
- 0.97% ✗
- Cap rate
- 7.47%
- Cash-on-cash
- 4.20%
- DSCR
- 1.19
- GRM
- 8.6
CMA / ARV
- ARV (median comp)
- $1,491,191
- List price
- $1,799,000
- Delta
- 20.64%
- Verdict
- OVERPRICED
- Comps
- 10 within 1.0 mi
Projected returns pro-forma
-3.0% appreciation · 0.0% rent growth · sell at horizon
- IRR
- -13.1%
- Equity multiple
- 0.54×
- Total profit
- $-230,116
- Equity at exit
- $268,237
- IRR
- -9.4%
- Equity multiple
- 0.50×
- Total profit
- $-252,729
- Equity at exit
- $155,545
Cash invested: $503,720 (down + closing). Projections, not guarantees.
Landlord ↔ Tenant lean methodology
- Overall (STATE)
- 18 Strongly Tenant-Friendly
- State California
- 18 Strongly Tenant-Friendly · D+13
- County
- — inherits STATE
- City
- — inherits STATE
ZIP-level market 91803
- Rents YoY
- -1.0%
- Active inventory
- 39
- Price-to-rent
- 43.1×
Monthly cashflow live
- Estimated rent
- $17,394 medium interval (Pro) →
- Mortgage (P&I)
- −$9,434
- Tax from tax record
- −$1,793 /mo · $21,514/yr
- Insurance
- −$750
- HOA
- −$0
- Vacancy / Maint / Mgmt
- −$3,653
- Net cashflow
- $1,765
Break-even live
Sensitivity live
| Price | -10% $2,783 | -5% $2,274 | +0% $1,765 | +5% $1,255 | +10% $746 |
|---|---|---|---|---|---|
| Rent | -10% $391 | -5% $1,078 | +0% $1,765 | +5% $2,452 | +10% $3,139 |
| Rate | -1.0pp $2,671 | -0.5pp $2,222 | base $1,765 | +0.5pp $1,298 | +1.0pp $824 |
5-unit breakdown (identical units grouped — click to expand)
| Units | Beds | Baths | Est. rent |
|---|---|---|---|
| 5× units | 9 | 9 | $17,395 |
| #1 | 9 | 9 | $3,479 |
| #2 | 9 | 9 | $3,479 |
| #3 | 9 | 9 | $3,479 |
| #4 | 9 | 9 | $3,479 |
| #5 | 9 | 9 | $3,479 |
| Total (5 units) | $17,394 | ||
UW: 25.0% down · 7.5% · 30yr · 1.5% tax · 5.0% vac · 8.0% maint · 8.0% mgmt
Financing live
Cash to close
- Down payment
- $449,750
- Closing costs
- $53,970
- Reserves months
- —
- Total cash needed
- —
Loan-product check · same deal, 3 products live
Conventional
25% down · 7.5% · 30yr
- Down + closing
- —
- Monthly P&I
- —
- Monthly cashflow
- —
- DSCR
- —
- Eligible?
- —
Personal DTI + credit; lowest rate.
DSCR
20% down · 8.5% · 30yr
- Down + closing
- —
- Monthly P&I
- —
- Monthly cashflow
- —
- DSCR
- —
- Eligible?
- —
No personal income docs; deal must DSCR.
Hard money
10% down · 12.0% · 12mo
- Down + closing
- —
- Monthly P&I
- —
- Monthly cashflow
- —
- DSCR
- —
- Eligible?
- —
Short-term bridge; refi at stabilization.
Listing history 16 events
-
2026-06-21days on market $1,799,000 Active 239 DOM
-
2026-06-18days on market $1,799,000 Active 236 DOM
-
2026-06-17days on market $1,799,000 Active 235 DOM
-
2026-06-16days on market $1,799,000 Active 234 DOM
-
2026-06-15days on market $1,799,000 Active 233 DOM
-
2026-06-13days on market $1,799,000 Active 231 DOM
-
2026-06-13days on market $1,799,000 Active 230 DOM
-
2026-06-09days on market $1,799,000 Active 227 DOM
-
2026-06-08days on market $1,799,000 Active 226 DOM
-
2026-06-07days on market $1,799,000 Active 225 DOM
-
2026-06-04days on market $1,799,000 Active 222 DOM
-
2026-06-03days on market $1,799,000 Active 221 DOM
-
2026-06-02days on market $1,799,000 Active 220 DOM
-
2026-06-01days on market $1,799,000 Active 219 DOM
-
2026-05-31days on market $1,799,000 Active 218 DOM
-
2025-10-25$1,799,000 Active 2007-char remark
Show marketing remark (2007 chars)
OUTSTANDING POTENTIAL!!!! Large lot of 6,615! With bus connectivity and access to nearby Metro and Metrolink lines, Edgewood sits within the type of transit-connected location increasingly sought after by multifamily and redevelopment investors. This is the property you've been waiiting for! Prime 5-Unit Investment Opportunity to add extra value to any investment portfolio! An exceptional opportunity for the savvy investor — this 5-unit income property is ideally located north of the 10 freeway in one of Alhambra’s most desirable and stable rental markets. All units are occupied with month to month tenants. Positioned in a high-demand neighborhood, the complex is conveniently close to Cal State LA, local schools, shopping, dining, and major employment hubs in Downtown Alhambra, Pasadena, and Downtown Los Angeles. Proforma reflects current market value at the time of the listing. All tenants have assigned parking, water and trash are included in the rent. This is a FANTASTIC opportunity and a great start for the new investor looking at multi-unit opportunities. Positioned in a fabulous neighborhood and set on a 6,615 sq. ft. lot, this property offers 4,422 sq. ft. of total living space with 9 bedrooms and 9 bathrooms across five units. There are four * 2 bed/2 bath units * and one * 1 bed/1 bath * . All are spaciously appointed with large living rooms and each unit enjoys on-site assigned parking, a very valuable amenity for tenants in this area. Potential for additional units must be verified with the city. The property also features an * * on-site laundry room * * with owner-operated machines, providing additional income potential and tenant convenience. With consistent rental demand, a prime commuter location, and solid fundamentals, this Alhambra property presents a rare opportunity to acquire a turnkey asset with long-term upside. Looking for a stable, income-producing property in a proven Los Angeles County market? This one checks all the boxes.
ⓘ Source: listings_history table (triggers on properties + properties_extension) + one-shot
backfill from property_details.listing_events for pre-trigger history.
Tax reassessment forecast CA · Resets to sale price
- Current annual tax
- $21,514 · $1,793/mo
- Projected year-2 tax
- $21,514 · $1,793/mo
- Expected delta
- $0/yr ($0/mo · 0.0%)
ⓘ Screening estimate from a state-policy table — verify with the county assessor before closing.
Climate risk First Street
- Flood 1/10 Low FEMA zone X (unshaded) · 0% chance over 30 yrs
- Wildfire 1/10 Low
- Heat 6/10 Major 7 d/yr ≥97°F today · 21 d/yr by 30 yrs out
- Wind 1/10 Low
- Air quality 6/10 Major 10 unhealthy d/yr today · 10 by 30 yrs out
Nearby sold comps map
Loading sold comps map…
Walkable amenities ~0.75 mi
Loading nearby amenities…
Taxation est. · year 1
- Rental income
- $208,728
- − Mortgage interest
- −$100,772
- − Property taxes
- −$21,514
- − Insurance
- −$8,995
- − Repairs & maintenance
- −$16,698
- − Management
- −$16,698
- − Depreciation
- −$52,335
- Taxable loss
- −$8,284
- Est. tax savings @ 24.0%
- +$1,988
- After-tax cash flow
- $23,164/yr
For passive investors: Depreciation is non-cash, so a rental often shows a tax loss while cash-flowing — sheltering income. Rental losses are passive: they offset passive income freely, and up to $25,000/yr can offset ordinary (W-2) income if you actively participate and your MAGI is under $100k (phasing out to $0 by $150k); unused losses carry forward. On sale, claimed depreciation is recaptured at up to 25%, and gains may owe capital-gains tax (a 1031 exchange can defer both). Figures are a year-1 estimate at your 24.0% rate — not tax advice; consult a CPA.
Schools (NCES district)
- District
- Alhambra Unified
- NCES district ID
- 0600153
- Math proficiency
- 56% ▲ 1.00%
- Reading proficiency
- 64% ▲ 1.00%
- Median HH income
- $53,271
- Composite
- 52.99/100
- National rank
- #3253
- State rank
- #262 of 1400 in CA
Livability — Alhambra
No livability data for this city. (Only ~50 U.S. cities are tracked.)
Census & demographics
- Census place
- Alhambra, CA
- County
- Los Angeles County · 9,444,647 people
- City population
- 81,096
- Metro
- Los Angeles-Long Beach-Anaheim, CA
- Population (ZIP)
- 27,715
- Household income
- $84,311
- Rent vs Own
- Severe rent burden
- 1540.0
Population outlook (Los Angeles County) Hauer SSP2
- Today (2025)
- 10,940,515 people
- By 2030
- 11,256,481 · +2.9%
- By 2040
- 11,729,929 · +7.2%
- By 2050
- 11,948,407 · +9.2%
- By 2075
- 11,818,114 · +8.0%
- By 2100
- 10,842,928 · -0.9%
Race, ethnicity, and origin ACS 2023
- Neighborhood character
- Diverse neighborhood (Simpson 0.59)
- Race & ethnicity
- Asian 50% Hispanic / Latino 39% Two or more races 14% White 7% Black 2%
- Hispanic origin (detail)
- Mexican 32%
- Common ancestry
- Slovak 1% Lithuanian 0%
- Foreign-born
- 47% · China, Canada, Vietnam
- Languages at home
- 29% English-only · Chinese 32% Spanish 27% Vietnamese 3%
Political lean MEDSL · Los Angeles
- 2024 margin
- Solid D (+32.9) · D 64.8% · R 31.9% · Other 3.3%
- 2008→2024 swing
- -7.4pp toward R · 2008: 40.4pp · 2024: 32.9pp
- All cycles
- 2024: D+32.9 2020: D+44.2 2016: D+48.0 2012: D+40.0 2008: D+40.4
Not yet ingested
- Civics
- —
Market trends
- HPI YoY
- ▼ -1044.70%
- Current HPI
- 430.896
- Rent YoY
- ▼ -0.98%
- Metro
- Los Angeles-Long Beach-Anaheim, CA
- State GDP YoY
- ▲ 3.21%
- F500 in state
- 116
Industry mix (Fortune 500 HQ in CA)
| Industry | F500 HQs | Revenue |
|---|---|---|
| Technology | 27 | $1,492B |
|
||
| Financial Services | 3 | $174B |
|
||
| Retail | 3 | $44B |
|
||
| Insurance | 3 | $26B |
|
||
| Media / Entertainment | 2 | $115B |
|
||
| Pharmaceuticals / Biotech | 2 | $62B |
|
||
Price history
1 event — show timeline
- 2025-10-25 Listed $1,799,000 CRMLS
Property tax history
+8.0%/yrLatest (2025): $21,514 · +3.0% YoY. Source: county tax records.
Cash-flow waterfall
monthlySold comps — $/sqft
last 12 mo · ≤1 miLoading sold comps…