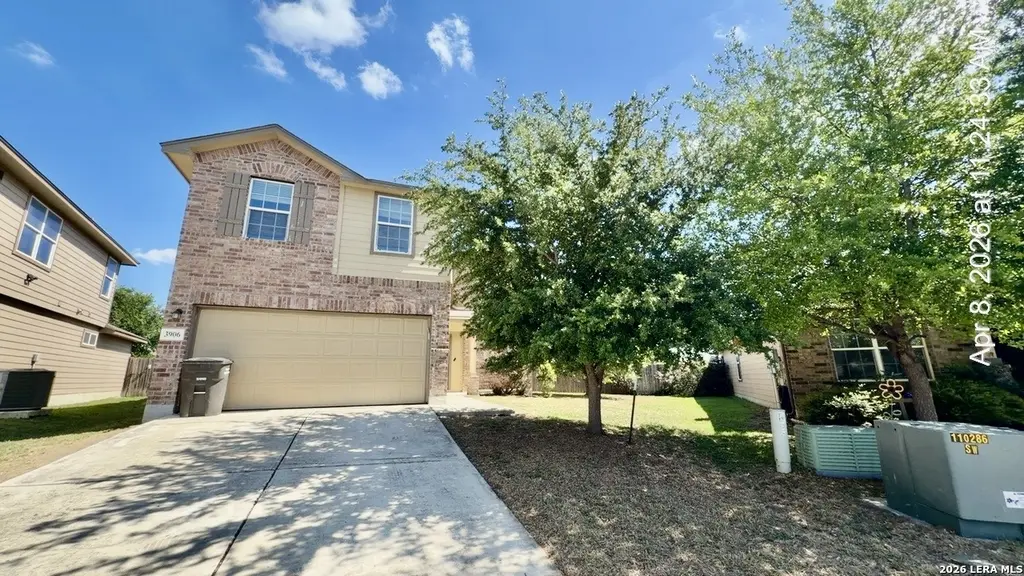
3906 Medina Br
San Antonio, TX 78222
$210,000D
3 bd · 2.5 ba ·
2,082 sqft ·
Built 2016
· SingleFamily
· Pending
· 38 DOM
Cashflow @ list (25.0% down · 7.5%)
Estimated rent
$1,844/mo
Mortgage (P&I)
−$1,101
Tax + insurance
−$565
HOA
−$25
Vac / Maint / Mgmt
−$387
Net cashflow
$-235/mo
Annual
$-2,816/yr
Cap rate
4.95%
Cash-on-cash
-4.79%
DSCR
0.79
1% rule
0.88%
Cash to close
$58,800
Investor read
- This is a 3-bed/2.5-bath single-family listed at $210k.
- At list price, monthly cash flow is $-235 ($-3k/yr) — negative.
- To cash-flow at today's rent, offer at most $169k (19.7% below list).
- To meet the 1% rule (rent ≥ 1% of price), the offer needs to be $184k (12.2% below list).
- It's been on market 38 days — a 3% lower offer ($204k) is reasonable based on typical stale-listing flexibility.
- Recommended offer: $169k (19.7% below list) — sets the bar for cash-flow.
- Local home prices are declining (-3.0%/yr); year-one equity from $1k of loan paydown is wiped out by about $6k of value loss. Plan a longer hold.
- Location reads 80/100 on livability (#31 in TX, #1,616 nationally) — a professional / high-income tenant draw. Strengths: amenities A+, commute A+, cost of living A+; Watch: crime F.
- East Central ISD (rural): math 16% / reading 25% proficiency, ranked #758 of 826 in TX (top 92%) — low school quality limits family demand, transient renter base, plan for 1-2y turnover; 61% free/reduced lunch — lower-income household profile, screen leases tightly.
- Zoned schools: Sinclair El (math 13% / reading 20%, grade F, #3,946 of 4,322 statewide, top 92%, 721 students, 71% FRL); Legacy Middle (math 13% / reading 24%, grade F, #1,478 of 1,662 statewide, top 90%, 1,137 students, 58% FRL); East Central H S (math 21% / reading 28%, grade F, #1,264 of 1,632 statewide, top 82%, 3,252 students, 52% FRL) — zoned schools at 60% FRL track the district average.
- Watch-outs: property tax is 2.7% of price.
- Market conditions: Rents rising fast (+4.3%/yr); 444 active listings in the ZIP; 40 comparable units currently listed for rent nearby; rentals at typical pace (median 26d on market — plan ~3-4 weeks tenant-placement turnaround); 8,308 units permitted in Bexar County in 2024 (2,506 in 5+ unit buildings).
- Bexar County population projected at +50% by 2050 — long-run rental-demand tailwind backs the buy-and-hold thesis.
- 3 sale attempts since 10y ago with the ask held roughly flat each time — persistent listings suggest the price (not the market) is what's stuck; bring a comps-based counter.
- Climate carrying-cost: severe wind risk, 80% chance of damaging wind over 30y; moderate wildfire risk; extreme-heat days projected 7→22/yr by 2055 (HVAC capex compounding) — expect insurance premiums to compound above CPI over the hold.
- Cap rate 5.0% vs local median 3.8% in San Antonio — meaningfully above typical; check what's discounted (condition, days-on-market, listing class) to confirm the premium yield is real.
- This rent runs 33% of the median local income ($66k/yr) — at the standard rent-burdened threshold; future hikes will face affordability resistance.
Questions for listing agent
- What do current leases actually rent for vs. the listed asking? Can we see a recent rent roll and the last 12 months of T-12 income?
- It's been on market 38 days. Have you received any prior offers? Is the seller open to a 20% concession, seller financing, or rate buy-down credit?
- Property tax is high relative to price — has the assessment been appealed recently, and will the sale trigger a re-assessment?
- What does the HOA fee cover, when was the last increase, and are there any pending special assessments or reserve-fund shortfalls?
- Is there a deadline driving the sale (1031 exchange, divorce, estate, relocation)? That informs how much negotiation room exists.
- Crime grade is F in this area — have there been break-ins, vandalism, or insurance claims at this property in the last 3 years? What carrier currently insures it and at what premium?
- The area grade is low — what's the realistic commute time and amenity access for the typical tenant pool here? Any planned neighborhood developments (good or bad) we should know about?
- What's the average days-on-market for RENTAL listings here right now (not sales)? A rising rental-DOM trend means longer vacancies and softer asking-rent achievability than the comps imply.
CashFlowRE · CFR-KK8RT0CDC9FGAG
· Data 3 weeks ago
cashflowre.app · 2026-05-29