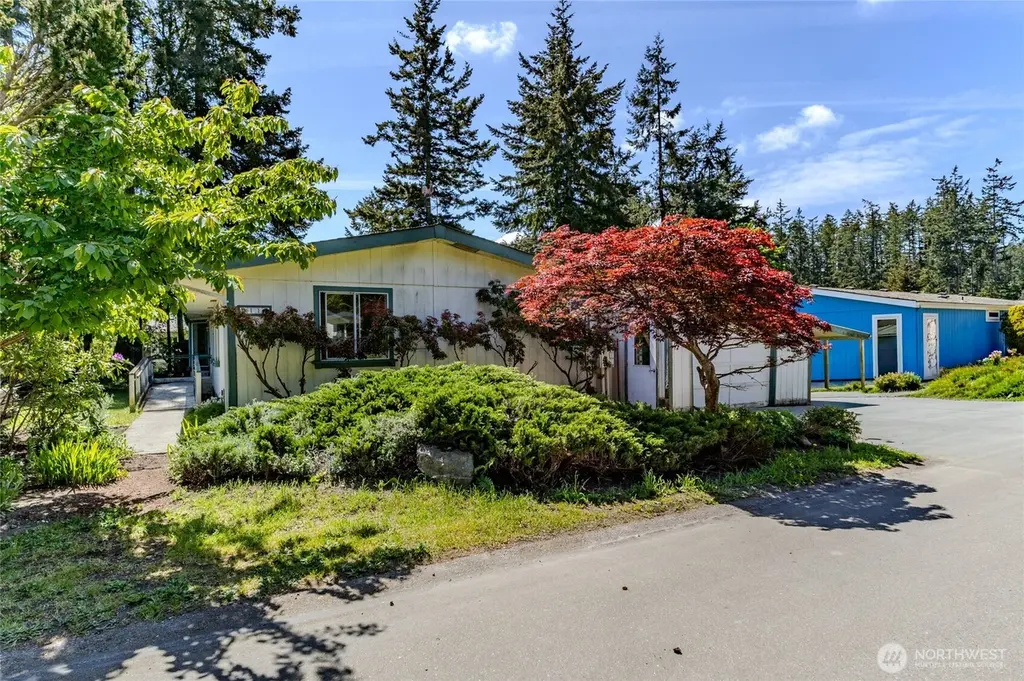
2119 Victoria Ave
Port Townsend, WA 98368
$249,000B-
4 bd · 2.0 ba ·
1,678 sqft ·
Built 1991
· Manufactured
· Pending
· 1 DOM
Cashflow @ list (25.0% down · 7.5%)
Estimated rent
$3,062/mo
Mortgage (P&I)
−$1,306
Tax + insurance
−$327
HOA
−$172
Vac / Maint / Mgmt
−$643
Net cashflow
$614/mo
Annual
$7,367/yr
Cap rate
9.25%
Cash-on-cash
10.57%
DSCR
1.47
1% rule
1.23%
Cash to close
$69,720
Investor read
- This is a 4-bed/2.0-bath manufactured listed at $249k.
- At list price, monthly cash flow is $614 ($7k/yr) — positive.
- The deal already cash-flows at list — no discount required.
- Meets the 1% rule at list price ($3k rent vs $249k).
- Only 1 days on market — expect competitive offers; lowballing is unlikely to land.
- Local home prices are declining (-3.0%/yr); year-one equity from $2k of loan paydown is wiped out by about $7k of value loss. Plan a longer hold.
- Location reads 58/100 on livability (#506 in WA) — a working-class tenant base; expect higher turnover. Watch: health & safety C-, employment D+, crime D.
- Port Townsend School District (town): math 47% / reading 64% proficiency, ranked #101 of 291 in WA (top 35%) — acceptable for families but not a draw, mixed tenant base, ~2y average lease.
- Zoned schools: Salish Coast Elementary (441 students, 51% FRL); Port Townsend High School (377 students, 49% FRL).
- Market conditions: 204 active listings in the ZIP; 147 units permitted in Jefferson County in 2024 (0 in 5+ unit buildings).
- Jefferson County population projected to shrink 5% by 2050 — rents likely to lag national; underwrite the cash flow, not the appreciation.
- 3 sale attempts since 23y ago with the ask held roughly flat each time — persistent listings suggest the price (not the market) is what's stuck; bring a comps-based counter.
- Current owner paid $145k; list at $249k implies a 72% gain — meaningful room to come down on a strong offer.
- Cap rate 9.3% vs local median 2.5% in Port Townsend — top-decile yield for the area; either an underpriced asset or a hidden risk that comps aren't pricing in. Stress-test before assuming the spread holds.
- At $3,062/mo this rent would consume 53% of the median local household income ($70k/yr) (locally 345% of renters already pay >50% of income on rent) — very limited rent-growth headroom before tenants either downsize or default.
Questions for listing agent
- What does the HOA fee cover, when was the last increase, and are there any pending special assessments or reserve-fund shortfalls?
- Is there a deadline driving the sale (1031 exchange, divorce, estate, relocation)? That informs how much negotiation room exists.
- Crime grade is D in this area — have there been break-ins, vandalism, or insurance claims at this property in the last 3 years? What carrier currently insures it and at what premium?
- What's the average days-on-market for RENTAL listings here right now (not sales)? A rising rental-DOM trend means longer vacancies and softer asking-rent achievability than the comps imply.
- What's the recent tenant-quality profile in this submarket — average credit score on applications, eviction rate, late-payment / NSF rate, and stable-employment percentage? A property-management company in the area should have these aggregated.
- How much new for-sale + rental construction is in the pipeline within 1–3 miles? Heavy new supply typically softens prices + rents 12–24 months out; constrained supply supports both.
CashFlowRE · CFR-KMA56ZB4DHJWKK
· Data 3 weeks ago
cashflowre.app · 2026-05-29